Product
Partner Program ROI: Prove What Partners Actually Add

Most partner programs can produce an impressive ROI slide. Few can survive one blunt question:
Would the deal have happened without the partner?
If every shared account becomes an "influenced pipeline", attribution turns into self-congratulation. Finance stops believing it. Sales stops updating it. The partner team ends up defending a number nobody trusts.
Your program does not need a bigger influence figure. It needs proof of what partners changed, what that change was worth and what it cost to create. The same discipline separates a channel worth funding from a spreadsheet that quietly drains budget.
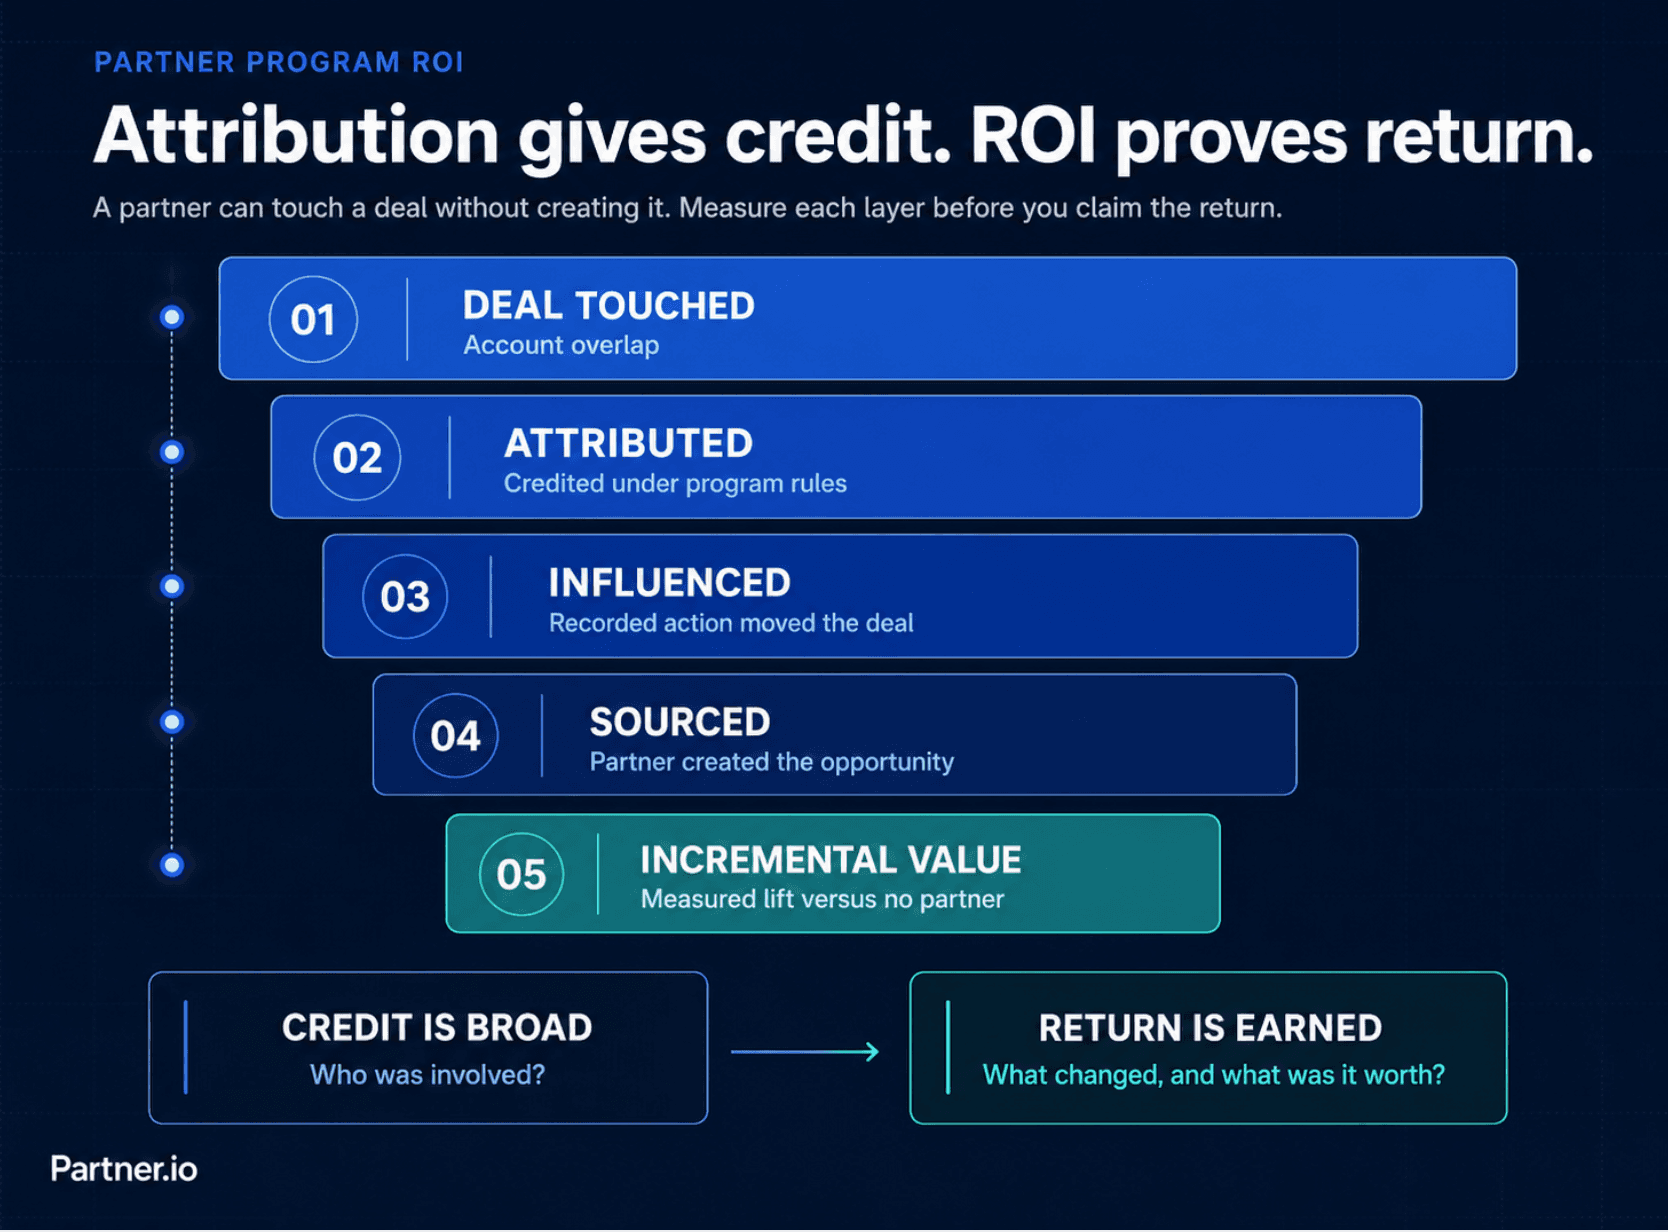
Figure 1. Credit is generous. Return is narrow. ROI belongs only to the proven, incremental layers.
Partner attribution is not ROI
Attribution gives credit. ROI proves return.
The two get muddled because there is no standard partner attribution model. Independent research on attribution consistently finds teams split across multi-touch, first-touch and last-touch rules, so the same deal journey can produce three different answers depending on the rule chosen.
Set the language before touching the dashboard.
Term | What counts | What does not |
|---|---|---|
Partner-sourced | The partner creates the qualified opportunity or makes the introduction that creates it | The account merely appears in a partner customer list |
Partner-influenced | A recorded partner action helps an existing opportunity progress | A logo overlap or vague claim made after the deal closes |
Partner-assisted | The partner completes a defined supporting action such as technical validation or scoping | Someone from the partner joins a call without a clear role |
Partner-attributed | Revenue or pipeline credited under your written rules | Proof that the partner caused the full outcome |
Incremental value | The improvement compared with what would have happened without the partner | The entire value of every deal a partner touched |
A partner can deserve credit for helping a £100,000 opportunity close without creating £100,000 of incremental revenue. The deal may have closed anyway.
That is why partner-sourced revenue and partner-influenced revenue need separate scorecards. Source can feed a direct ROI calculation. Influence needs evidence of lift.

The partner program ROI formula
Use this:
Partner program ROI = (attributable gross profit − fully loaded program cost) ÷ fully loaded program cost × 100
Not pipeline. Not annualised contract value against one month of costs. Gross profit earned in the same period as the costs used to produce it.
For a young SaaS program, first-year gross profit is usually the cleanest basis. Lifetime value can flatter an immature channel because it relies on churn and margin assumptions that have not yet survived a renewal cycle.
Keep three views separate:
Realised ROI: gross profit already earned against costs already incurred
First-year cohort ROI: first-year gross profit from a partner-sourced customer cohort against the cost of acquiring and supporting it
Forward view: sourced pipeline, influenced pipeline and expected revenue, clearly labelled as forecast
A worked example
A referral program produces £150,000 in first-year revenue at an 80% gross margin. The figure that matters is not the revenue, it is what survives once every cost is counted.
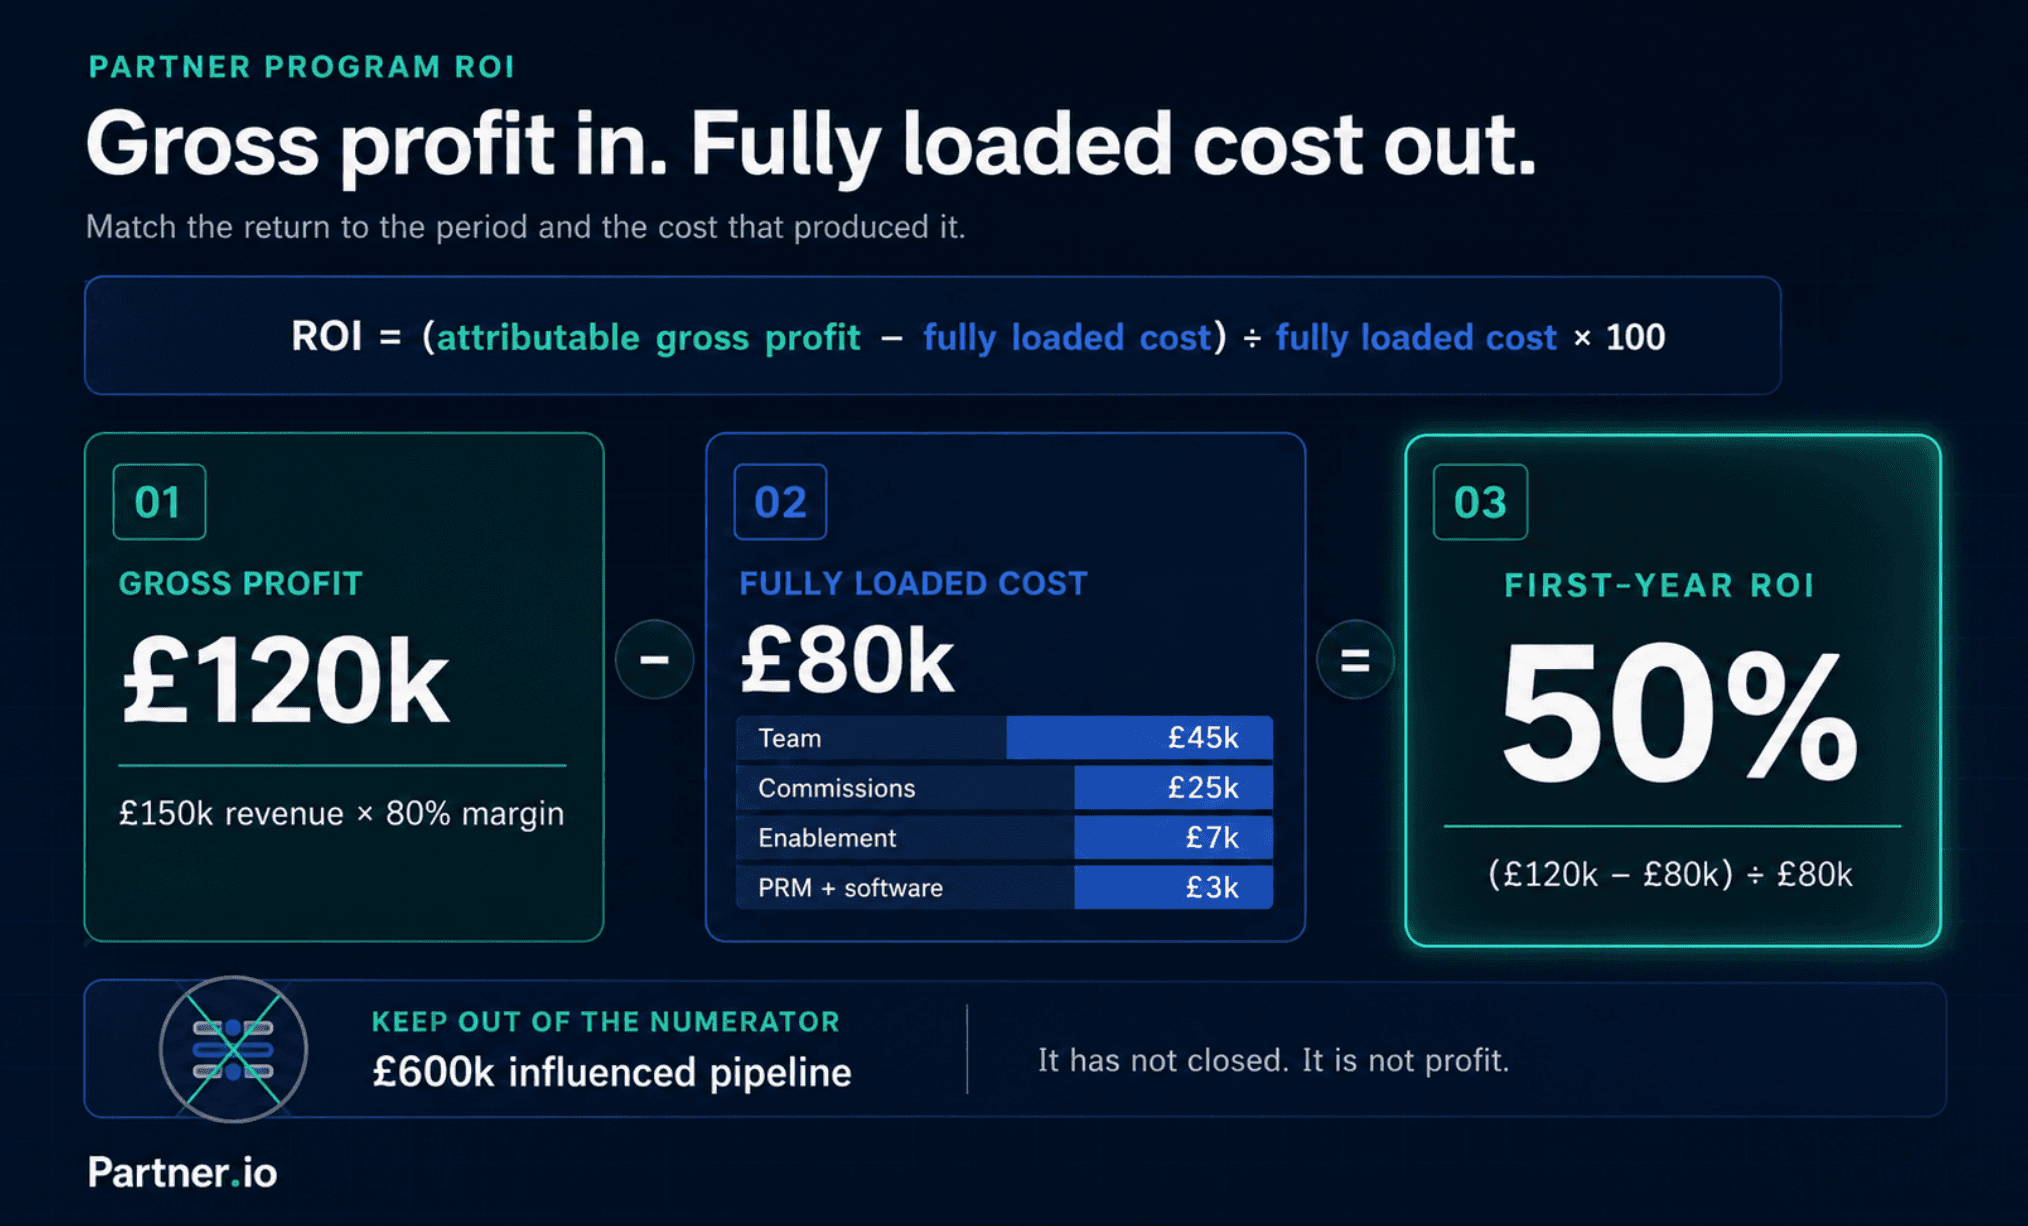
Figure 2. The ROI calculation in full: £120,000 gross profit against £80,000 of fully loaded cost returns 50%.
The same team may also have £600,000 of partner-influenced pipeline. Keep it out of the ROI numerator. It has not closed, it is not profit, and the partner incremental effect has not been proven.
That does not make influence worthless. It makes the measurement honest. Test influenced deals for changes in win rate, contract value and sales cycle instead.
If you want the same comparison run against paid acquisition, we broke it down in £1 on ads versus £1 on partners.
Stop defending numbers nobody trusts. Try Partner.io free for 7 days and make every partner contribution traceable.
Count every cost, or the ROI is fiction
Weak ROI models obsess over revenue and ignore the effort required to produce it. Include:
Salary and employer costs, allocated by time spent on the motion
Commission, revenue share, reseller discounts and referral fees
PRM, account mapping, CRM, data and payment software
Market development funds and co-marketing spend
Events, travel, sponsorship and partner hospitality
Onboarding, training, certification and content production
Integration build and maintenance
Sales engineering and customer success effort created by the channel
Rebates, deal protection and promotional discounts
Payment processing, foreign exchange and tax administration
Do not double-count costs already captured in gross margin. Do not compare annual recurring revenue with a quarter of spend. Match the money and the period.
TRACE: a proof chain for partner ROI
The formula is the easy bit. The hard part is creating an evidence trail that survives a sales review, a commission dispute and a finance meeting.
TRACE gives that trail five links. Break one and the ROI claim weakens.
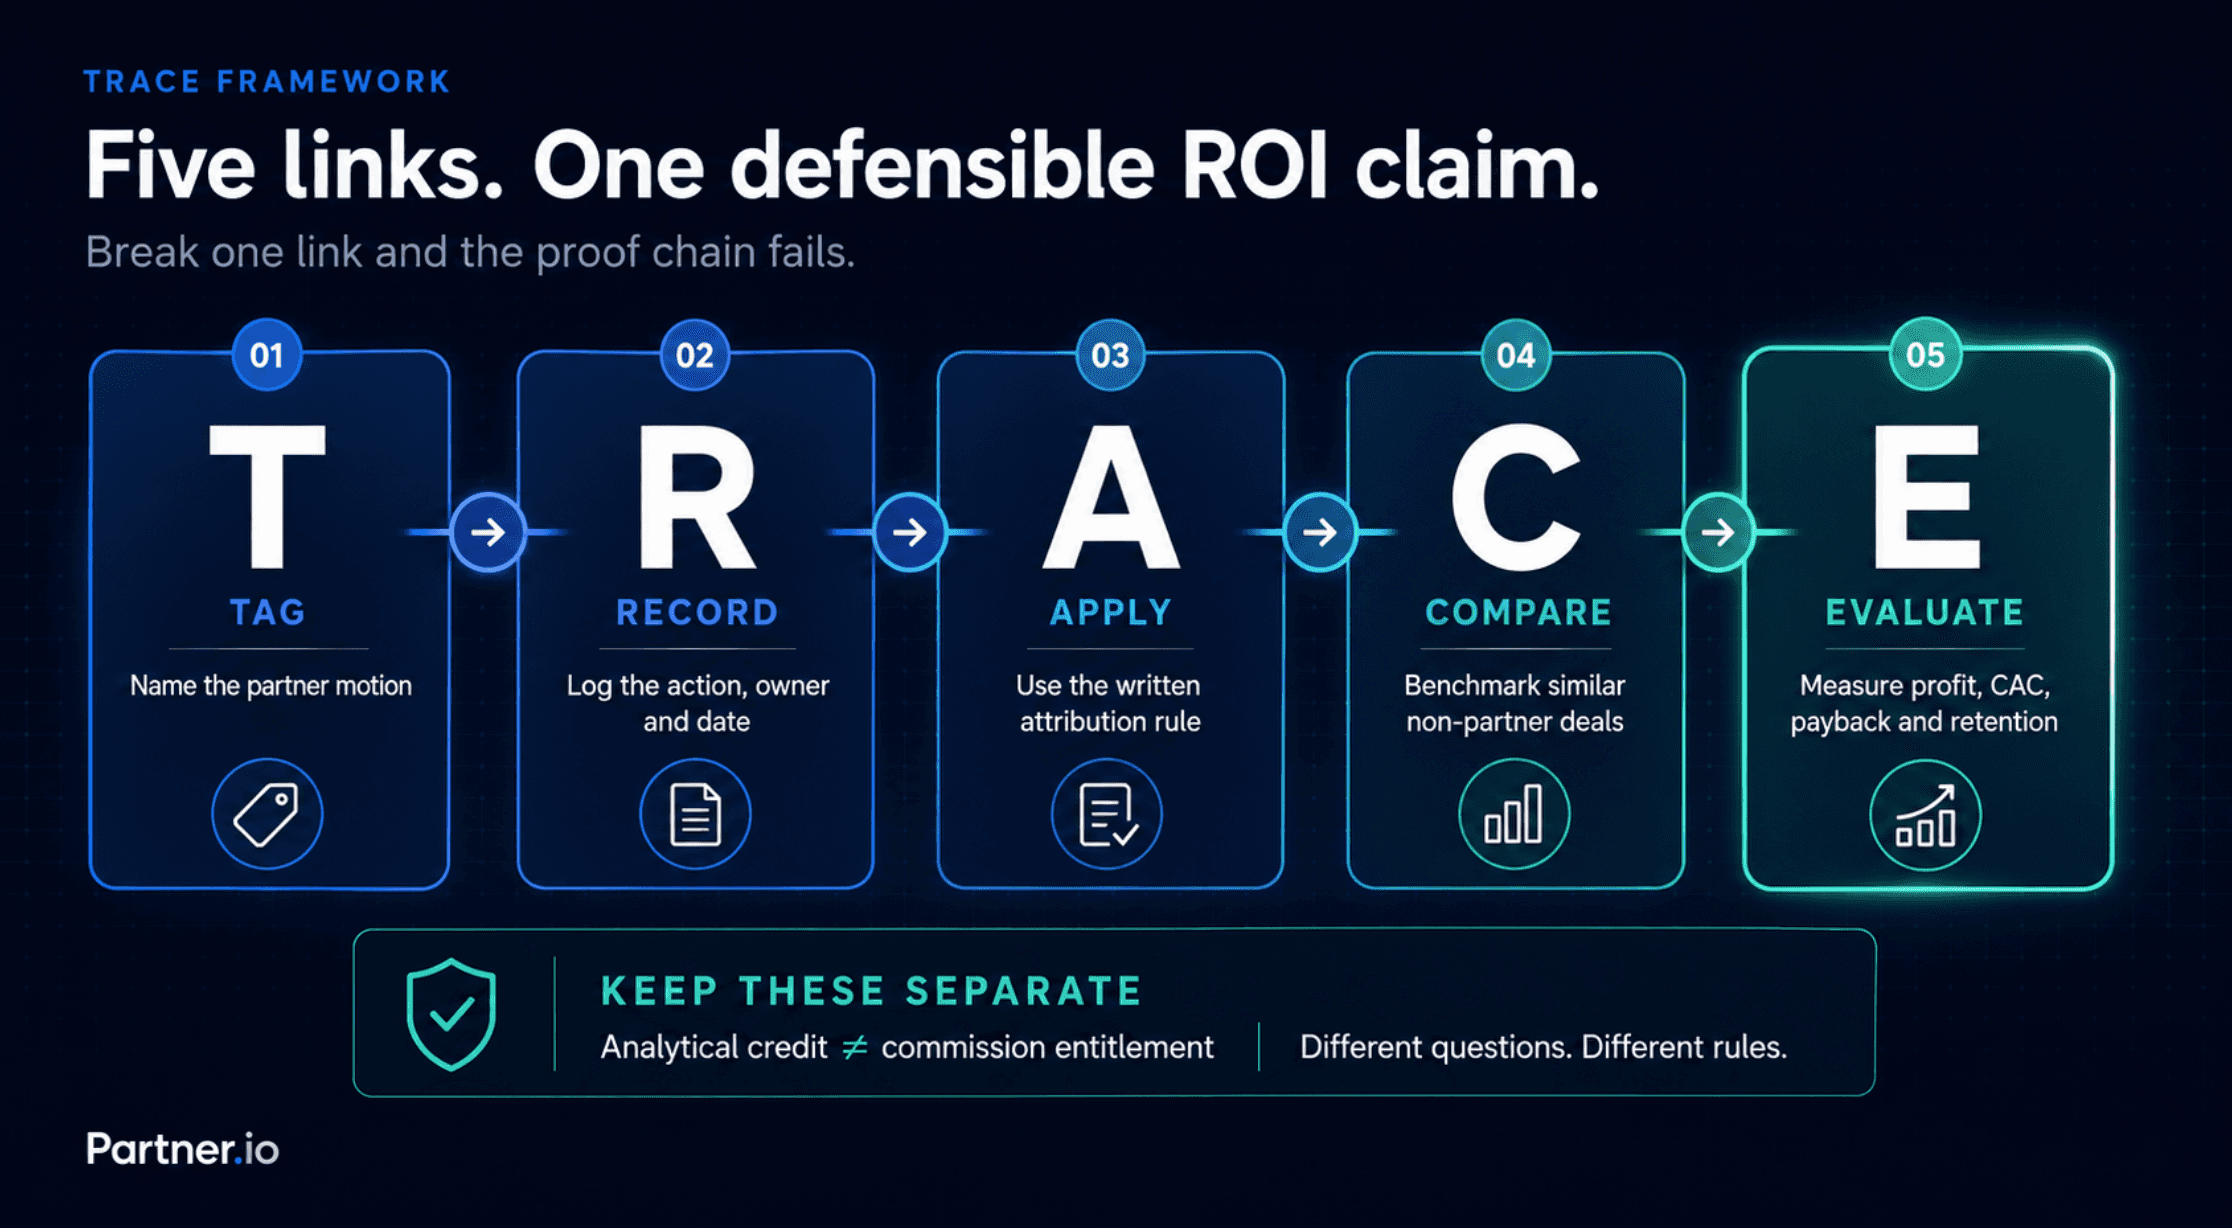
Figure 3. TRACE: Tag, Record, Apply, Compare, Evaluate. Each link has to hold for the ROI number to mean anything.
T: Tag the motion
Label each opportunity by the motion used: referral, co-sell, agency or service partner, technology integration, or reseller and distributor.
Tag the deal, not just the partner. An agency may source one customer, influence another and implement a third. Those contributions have different proof requirements and different economics. If your CRM already carries partner tags, a Salesforce integration that mirrors your stages and fields keeps the tag attached as the deal moves.
R: Record the action
Capture partner activity when it happens. Quarter-end archaeology produces biased data.
Useful evidence includes an accepted referral, a warm introduction, a partner-originated meeting, a joint account plan, a technical validation, an integration-generated signup, a reseller registration or a documented expansion recommendation.
Each record needs a partner, account, opportunity, action, date, owner and source. A free-text CRM note is not a reporting system.
A: Apply the rule
Write an attribution charter before the disputed deal appears. It should settle:
What creates sourced credit
What qualifies as influence
The latest sales stage at which influence can be claimed
How long source protection lasts
What evidence is compulsory
How multi-partner deals are de-duplicated
Who earns commission when several partners contribute
Who resolves disputes
Analytical credit and commission entitlement are not the same thing. Two partners may influence a deal while only the registered source earns a referral fee. Mixing those systems creates arguments and corrupts the data.
C: Compare the outcome
Influence becomes useful when partner-involved opportunities are compared with similar non-partner opportunities. Test opportunity acceptance rate, win rate, median contract value, days to close, discount rate, product activation, gross and net revenue retention, expansion revenue and support burden.
Match by customer size, product, region, source, sales team and period where possible. Comparing an enterprise co-sell deal with a self-serve signup proves nothing.
Watch for selection bias. Salespeople often invite partners into deals already expected to close. Track the stage at which the first partner action occurred, then compare performance from that point.
E: Evaluate the economics
Finish with money: attributable gross profit, fully loaded program cost, partner CAC, CAC payback, commission as a percentage of gross profit, gross profit per active partner, and retention and expansion by customer cohort.
Revenue per registered partner is a vanity metric when most registered partners are inactive.
Gross profit per active partner shows the program productive capacity. Revenue per registered partner mostly shows how many logos you have collected.
Measure each partner motion differently
A single scorecard rewards the wrong behaviour because different partners create value in different ways. This is also the gap between having partners and running a partner program.

Figure 4. The proof each motion owes you, the metric that matters, and the trap each one falls into.
The decision points follow the motion:
High referral volume with low acceptance means the referral trigger is too loose. Tighten the ideal customer profile and show partners examples of good and bad submissions.
Strong agency-sourced conversion with poor retention points to customer fit or implementation quality. More referrals will deepen the problem, not solve it.
Plenty of installs but little active use is distribution without adoption. Fix the product experience before funding more co-marketing.
Impressive reseller bookings with weak economics hide behind gross numbers. Measure revenue after discounts, rebates, enablement, support and failed collections.
Partner quality matters more than partner volume. Independent go-to-market benchmarking such as the Ebsta and Pavilion GTM research shows warm and referred pipeline converting well above cold sources. Treat that as a reason to measure quality, not a benchmark to paste into a forecast.
What credible partner program reporting looks like
The executive dashboard should fit on one screen and answer three questions.
Question | What the report shows |
|---|---|
Is it making money? | Partner-sourced revenue, attributable gross profit, fully loaded cost, ROI and CAC payback |
Are partners improving deals? | Accepted sourced pipeline, influenced pipeline, win-rate comparison, median sales cycle and contract value |
Can the motion repeat? | Active partners, activation rate, time to first accepted opportunity, revenue-producing partner rate and cohort retention |
Filter every view by partner, motion, product, region, cohort and period. A program where one reseller creates 70% of revenue has concentration risk, even if the blended ROI looks healthy.
Review flow weekly, performance monthly and economics quarterly. The quarterly review must end with named decisions: scale, repair, pause or exit. "Keep building relationships" is not a decision.
What this looks like in practice
Consider a composite example from a growing SaaS company.
Its monthly report shows £640,000 of influenced pipeline. Sales checks the opportunities and finds that most were tagged because the accounts appeared on partner customer lists. No introduction. No joint action. No proof that the partner changed the deal.
The team applies TRACE. Influence now requires a recorded action before commercial negotiation. Source requires an accepted registration before the opportunity exists in the CRM.
The headline falls to £210,000 of qualified influenced pipeline. Good. The inflated number was hiding the useful one.
The referral motion has produced £120,000 in first-year revenue at an 82% gross margin, leaving £98,400 in gross profit. Fully loaded program cost is £72,000.
(£98,400 − £72,000) ÷ £72,000 = 36.7% first-year ROI
The co-sell cohort also closes faster than a comparable non-partner cohort, although the sample is still too small for a causal claim.
The team no longer has to defend a vague £640,000 figure. It can show realised return, credible influenced pipeline and the next hypothesis worth testing.
When measurement breaks
Symptom | Cause | Fix |
|---|---|---|
Sales adds partners after the deal closes | Credit hunting or poor data hygiene | Require timestamped evidence, stage cut-offs and approval for retroactive claims |
Partners stop registering deals | The process is slow or deal protection feels worthless | Shorten the form, publish protection rules, set a response SLA and show deal status |
Influenced revenue exceeds company revenue | The same opportunity is counted once for each partner | Keep participation at partner level, but de-duplicate opportunity value in program totals |
Finance rejects the ROI figure | ARR replaced gross profit, costs omitted or forecast shown as realised | Agree the revenue basis, margin, cost allocation and reporting window with finance |
The sample is too small | The program is young or sales cycles are long | Report the evidence chain and leading indicators without pretending the uplift is proven |
Pipeline grows but return does not | Low quality, weak conversion, heavy discounting or hidden support cost | Trace the leak by motion and fix the economics, not the engagement score |
Deal registration deserves special attention. It only works when partners receive something in return: protection, a quick decision and visibility. Channel practitioners frame registration as a way to control conflict and improve pipeline visibility. Turn it into internal paperwork and partners will route around it. The operational fix is the same one behind turning handshakes into repeatable revenue.
Put the model into operation in 90 days
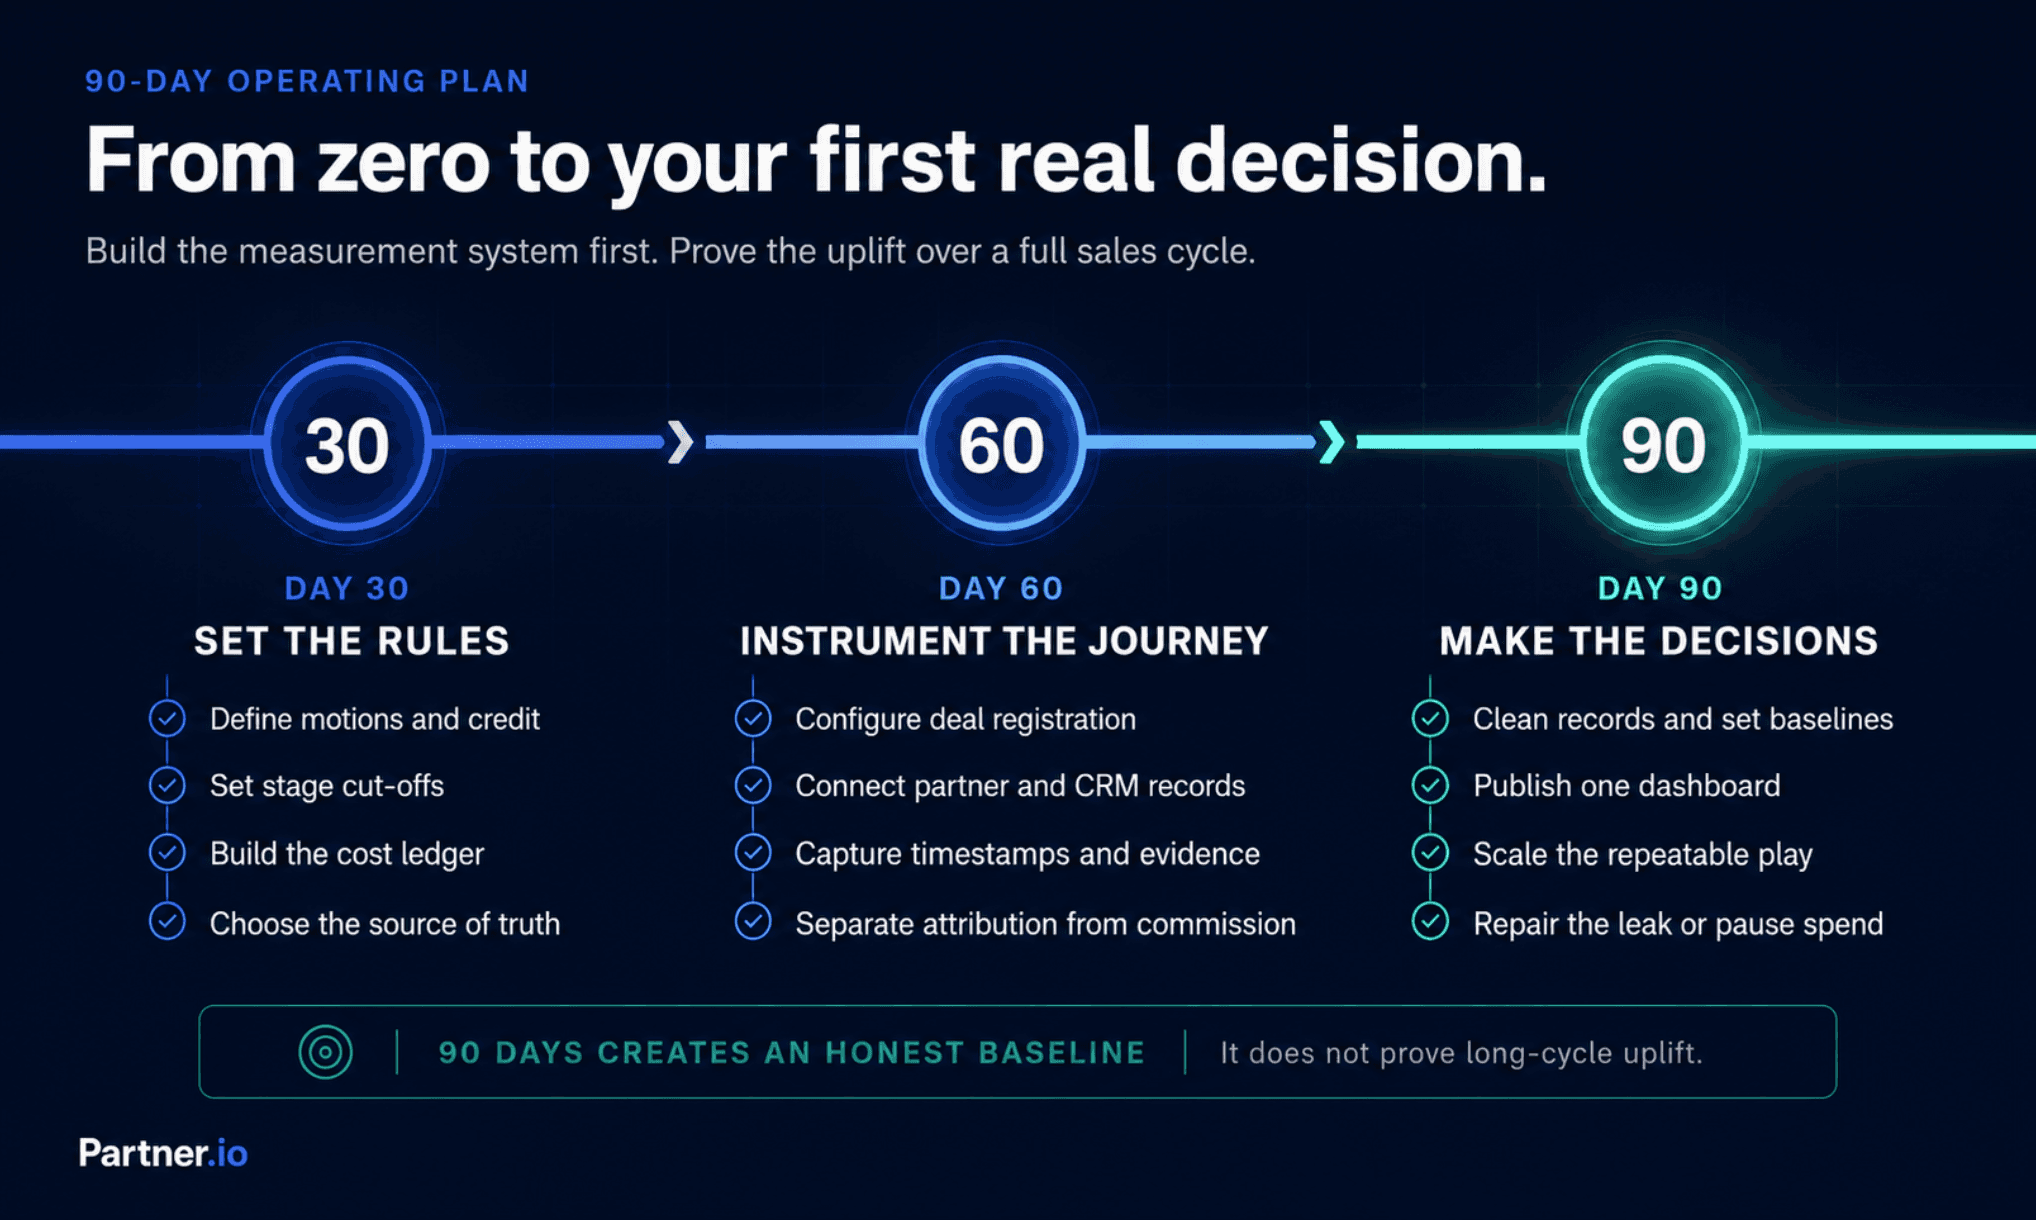
Figure 5. Ninety days buys clean instrumentation and an honest baseline, not a finished verdict.
First 30 days: set the rules
Define each motion, sourced credit, influenced credit, mandatory evidence, stage cut-offs, protection windows and multi-partner treatment. Build the fully loaded cost ledger. Choose the source of truth for partner, deal, revenue and payout data.
Next 30 days: instrument the journey
Configure deal registration and approval. Connect partner records to CRM opportunities. Capture timestamps and evidence. Set sales follow-up and partner-update SLAs. Separate attribution from commission rules.
By day 90: make the first decisions
Clean current records. Establish partner and non-partner baselines. Publish one dashboard. Scale the strongest repeatable play, repair one clear funnel leak and pause spend where the evidence is weak.
If the sales cycle is longer than 90 days, do not manufacture a mature ROI verdict. Ninety days gives you clean instrumentation and an honest baseline. The return will take a full sales and renewal cycle to prove.
Partner ROI needs an operating system
A spreadsheet can calculate ROI. A CRM can store a partner field. Neither can run the whole motion once referrals, co-sell activity, agencies, integrations, resellers and commissions start crossing the same opportunities.
This is where Partner.io fits. It connects deal registration, partner activity, CRM data, commissions, payouts and partner visibility. The attribution policy stops living in a document and starts shaping how deals are submitted, accepted, updated and paid.
That changes the quality of the data because it changes the behaviour behind it:
Partners use one route to submit opportunities
Sales accepts or rejects them against visible rules
Attribution is captured while the work happens
Revenue and payout status stay connected
Partners can see progress without chasing for updates
Every report uses the same partner and opportunity record
The result is not a prettier dashboard. It is a partner program that sales can work, finance can audit and partners can trust.
Do not scale a channel built on disputed credit and spreadsheet archaeology.
Make every partner contribution traceable from registration to revenue, then put more money behind what works. If you are still deciding whether the channel is even worth it, start with what partner-led growth actually is.
See how Partner.io makes partner ROI measurable. Try Partner.io free for 7 days.