Product
Partner Program Metrics for SaaS: What to Track, What to Delete
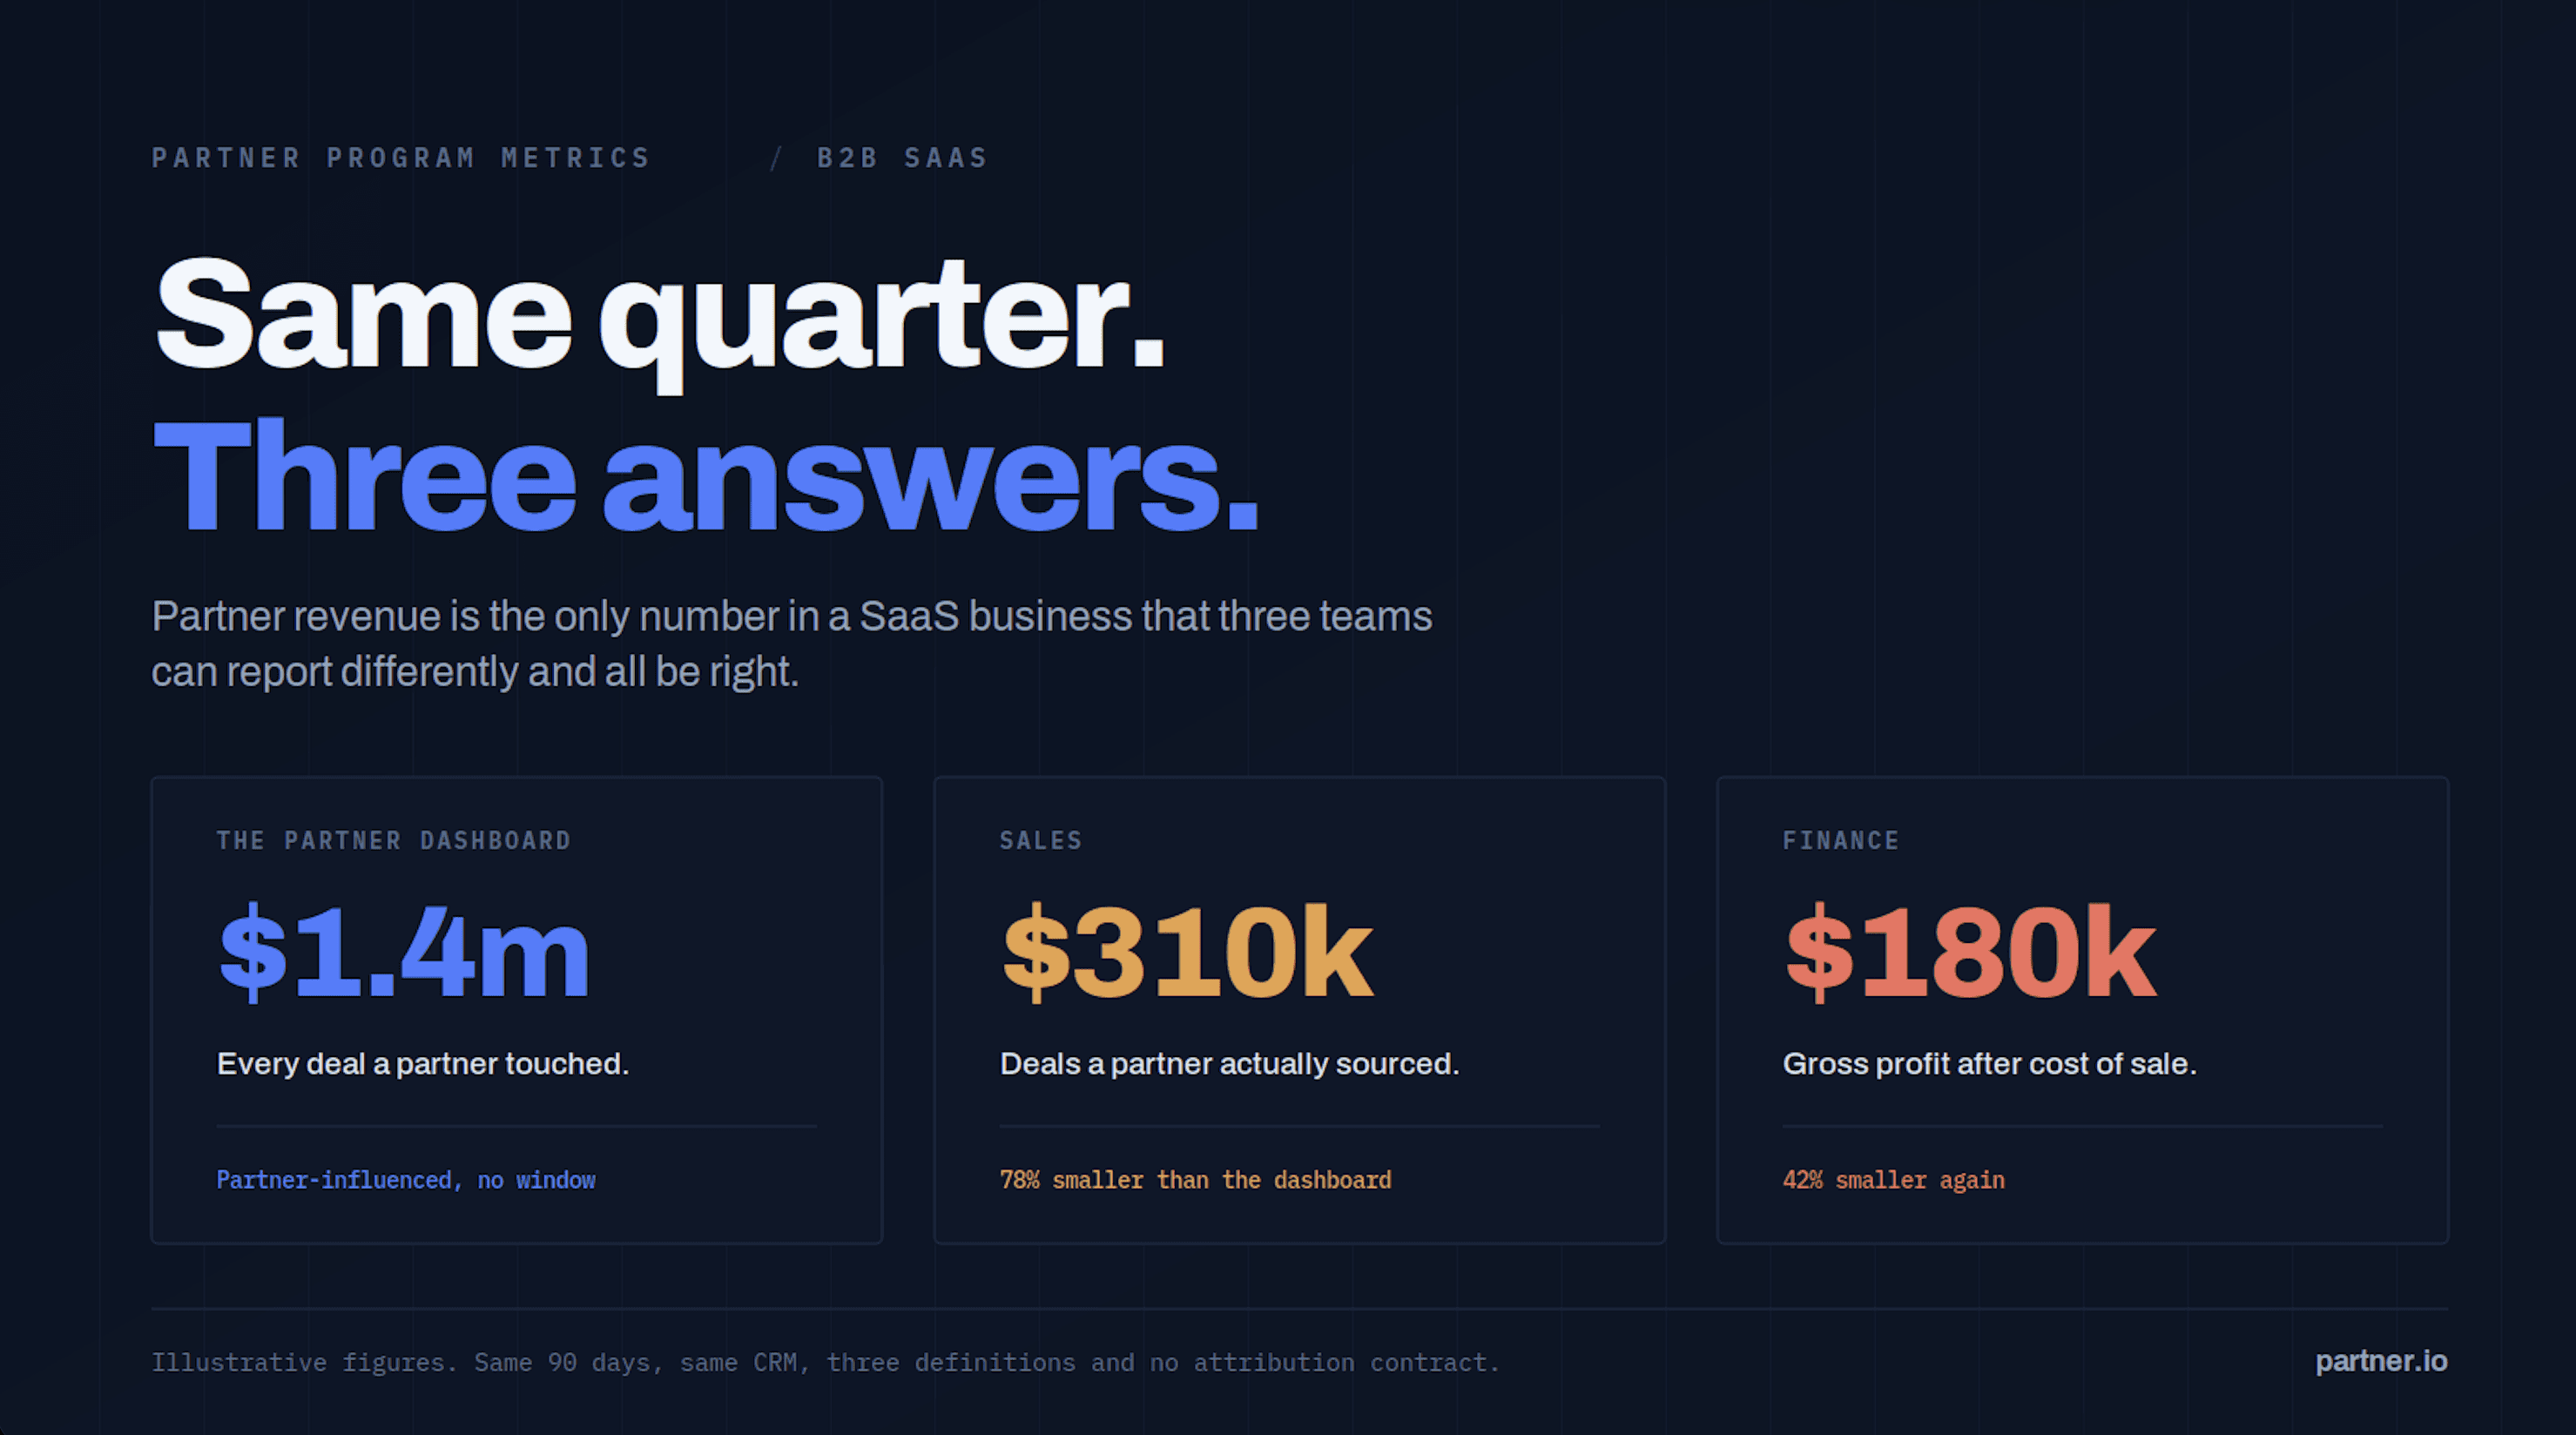
Your partner dashboard says the program is growing.
Sales says the pipeline is theirs. Finance is questioning the commissions. And half the partners labelled "active" have never produced a qualified opportunity.
All three can be right at the same time. That is what bad partner measurement looks like: plenty of activity, no agreed version of revenue.
When budgets tighten, an inflated dashboard does more than waste a Thursday afternoon. It destroys trust in the entire program, and trust is the only reason a sales team ever works a partner lead twice.
Fixing it does not start with more KPIs. It starts with three decisions: what each partner motion is meant to do, what evidence earns credit, and which commercial action each metric should change.
Everything below is built on those three.
Most partner reporting starts with the wrong question
Search for SaaS partner program metrics and you will find confident targets for activation rate, partner-sourced pipeline and time to first deal.
Most of them are useless.
They do not define an active partner. They mix submitted leads with qualified opportunities. They compare referral partners with resellers and global systems integrators. Change the denominator and a healthy-looking rate collapses.
A benchmark without a definition is a number wearing a lab coat. Two companies can report the same 40% activation rate while one counts portal logins and the other counts accepted opportunities, and no amount of decimal places will tell you which is which.
That is why this article contains no industry averages. Vendor-published partnership benchmarks are marketing assets first and research second, and the survey samples behind them rarely resemble a $5 million SaaS company. Your own last two cohorts are better evidence than anyone else's median.
Start with the decision, then pick the metric
A metric exists to change what you do on Monday. If it cannot, it is trivia.
Question you actually have | Metric that answers it | Decision it forces |
|---|---|---|
Are we recruiting the right partners? | ICP-fit rate and productive-partner rate by cohort | Narrow, continue or stop recruitment |
Can new partners reach first value? | Activation rate and median time to first value | Repair onboarding or repair the offer |
Are referrals worth sales time? | Acceptance rate, win rate, ARR per accepted referral | Tighten qualification or expand coverage |
Does co-sell actually move deals? | Verified actions, stage conversion, cycle time vs a matched baseline | Expand, redesign or end the motion |
Are resellers profitable? | Gross profit after discount, support and program cost | Change margin, tier or territory |
Does an integration create customer value? | Activated usage, influenced pipeline, retention | Invest in adoption or stop funding it |
If a metric cannot change a decision, keep it off the executive dashboard.
Print that and stick it on the wall of whoever builds your reporting.

Stop measuring unlike partner motions in the same number
A referral partner originates an opportunity and hands it over.
A reseller may own most of the commercial process, including the paper.
An agency partner can refer, implement and influence expansion, sometimes on the same account in the same quarter.
A technology partner might create demand, improve retention, or quietly rescue an open deal in a security review.
And co-sell requires two sales teams to act around one account, which is a coordination problem before it is a measurement problem.
Calling all of that "partner revenue" removes exactly the information you need to improve any of it.
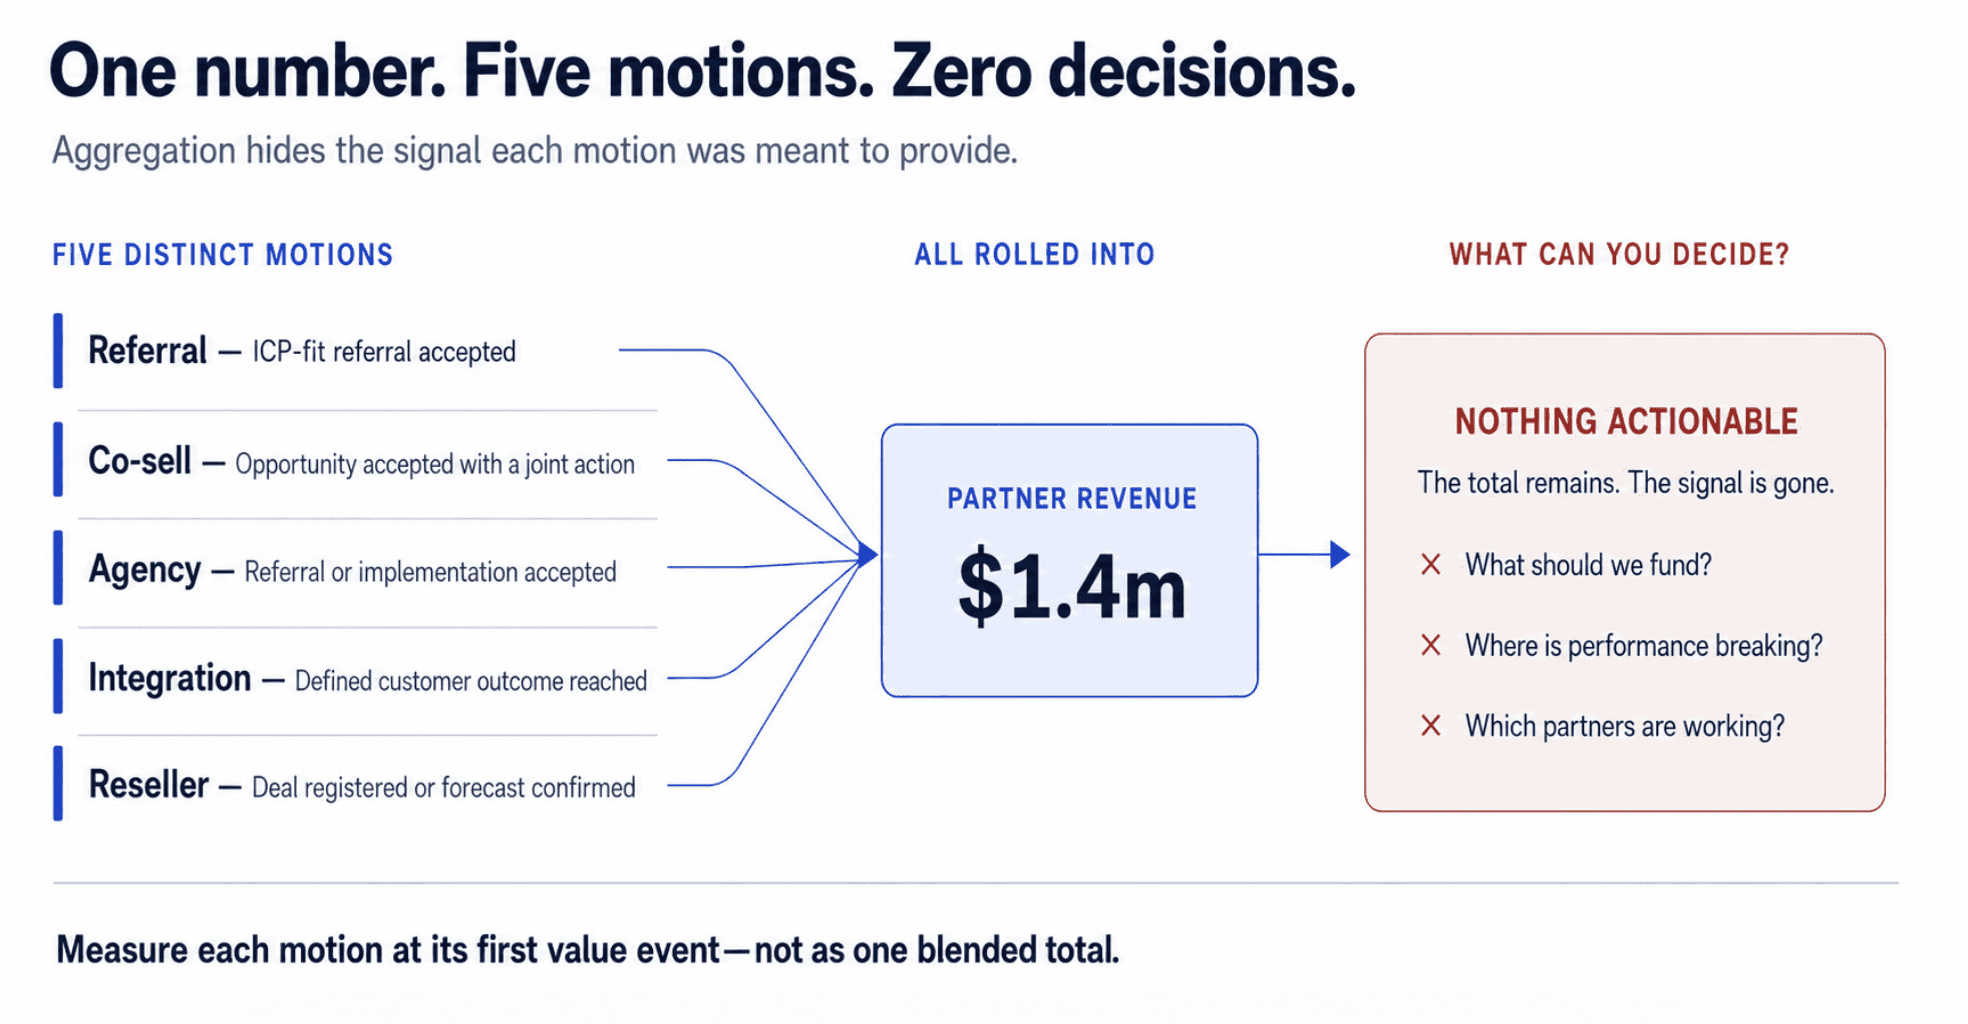
Figure 1: Aggregation is not simplification. Five motions with five different proofs of value collapse into one number, and every decision the number was supposed to inform disappears with them.
Build the scorecard around the job each motion performs
Motion | First value event | Commercial proof |
|---|---|---|
Referral | First accepted, ICP-fit referral | Qualified pipeline, sourced ARR, win rate, commission |
Co-sell | First accepted opportunity with a named joint action | Stage movement, velocity, win rate vs matched deals |
Agency | First accepted referral or assigned implementation | Sourced ARR, services attach, adoption, retention, expansion |
Integration | First customer reaching a defined integration outcome | Retained usage, influenced pipeline, retention, expansion |
Reseller | First accepted deal registration or valid forecast | Bookings, ARR, gross profit, forecast accuracy, renewals |
This distinction changes what the word "active" is allowed to mean. A reseller that completed training is not active if it has no registered pipeline. An integration partner is not productive because its logo appears in a marketplace. And a co-sell meeting is not influence unless something measurable happened to the deal.
If you are still deciding which motions to run at all, start with the difference between having partners and running a partner program and come back to the measurement question afterwards. Measuring a motion you have not designed is how dashboards get invented to fill a slide.
The LIVE framework: four gates before a metric reaches leadership
LIVE is a four-stage test for partner data:
Link the records
Identify the motion
Verify the event
Evaluate the economics
The order is not decorative. You cannot calculate honest ROI from an opportunity that is not linked to a known partner or supported by a verified action. Skip a gate and everything downstream inherits the error.
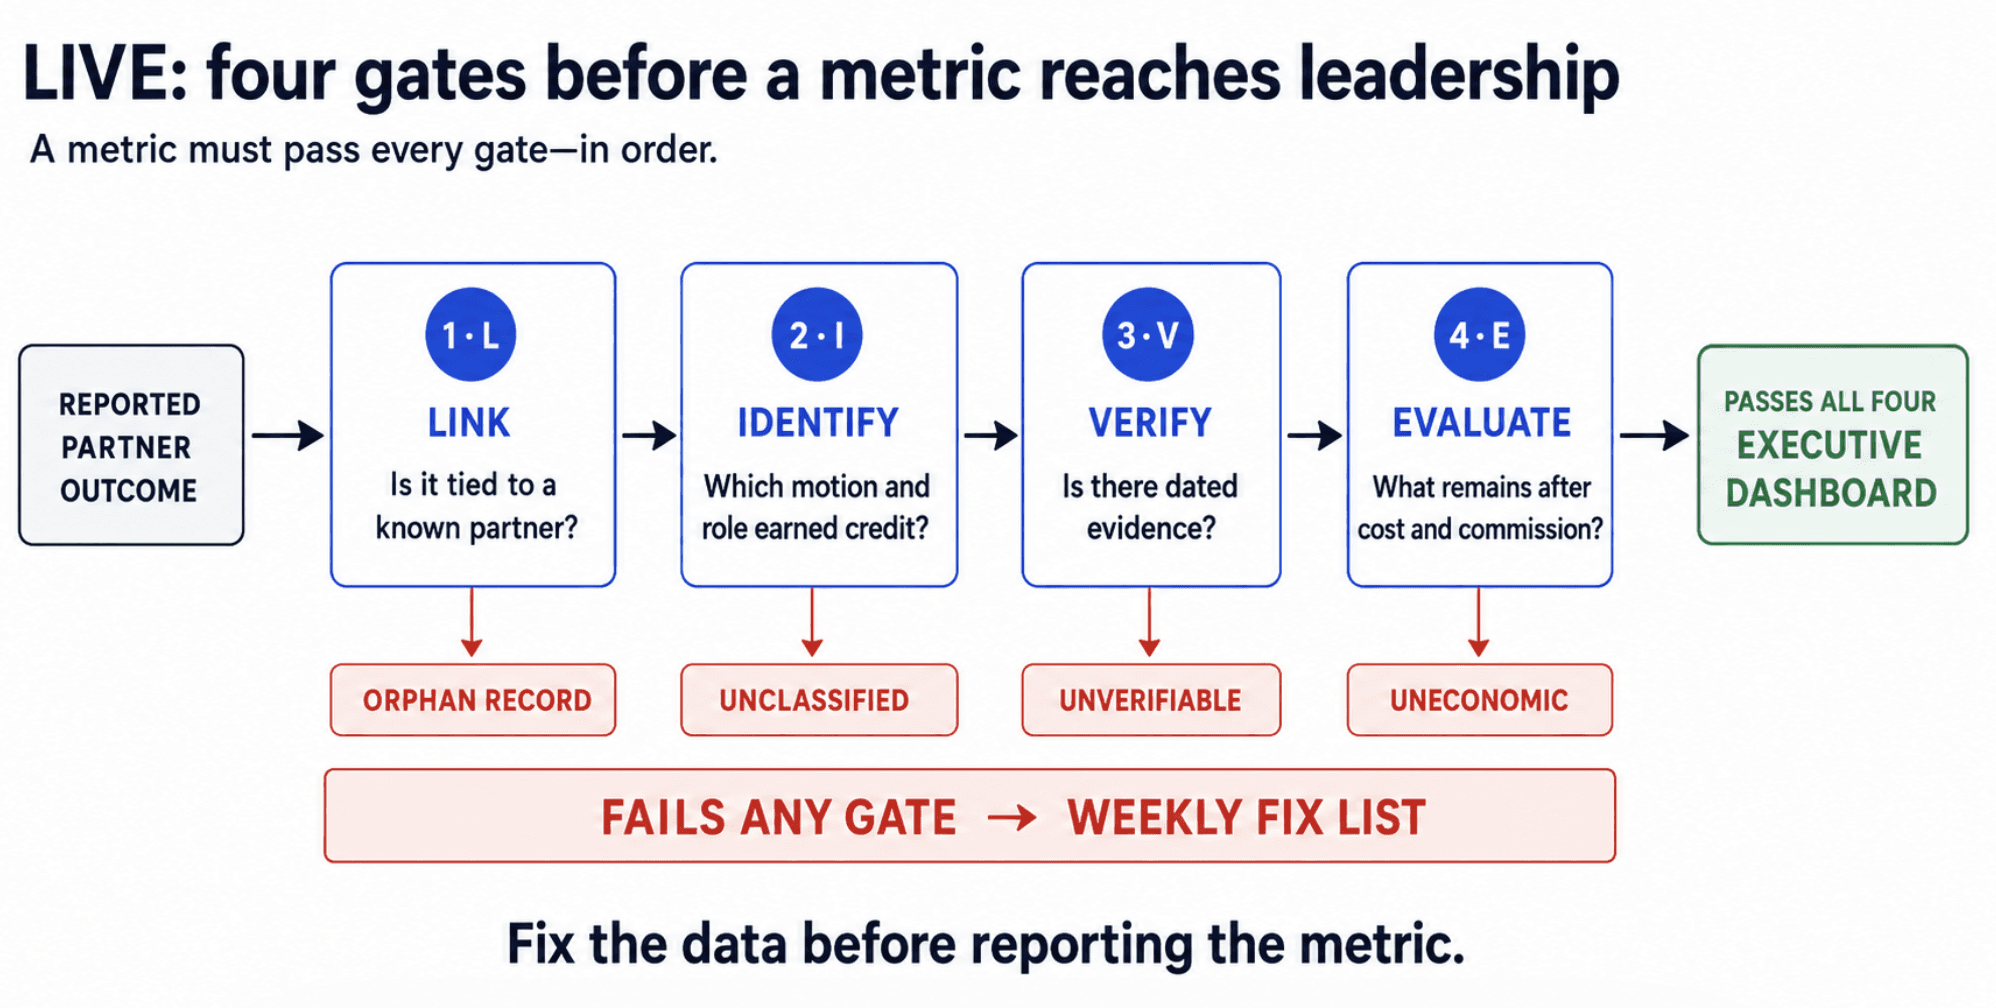
Figure 2: Four gates, four ways to be wrong. A reported partner outcome only reaches the executive dashboard if it survives linkage, motion classification, event verification and economic evaluation.
L: Link the records
Every reported outcome needs one unbroken chain:
Partner ID to partner contact to customer account to CRM opportunity to commission record.
Names are not identifiers. "Acme", "Acme Ltd" and "Acme EMEA" will split one relationship across three reports and nobody will notice until finance does. Email addresses change. People leave. Free-text fields rot.
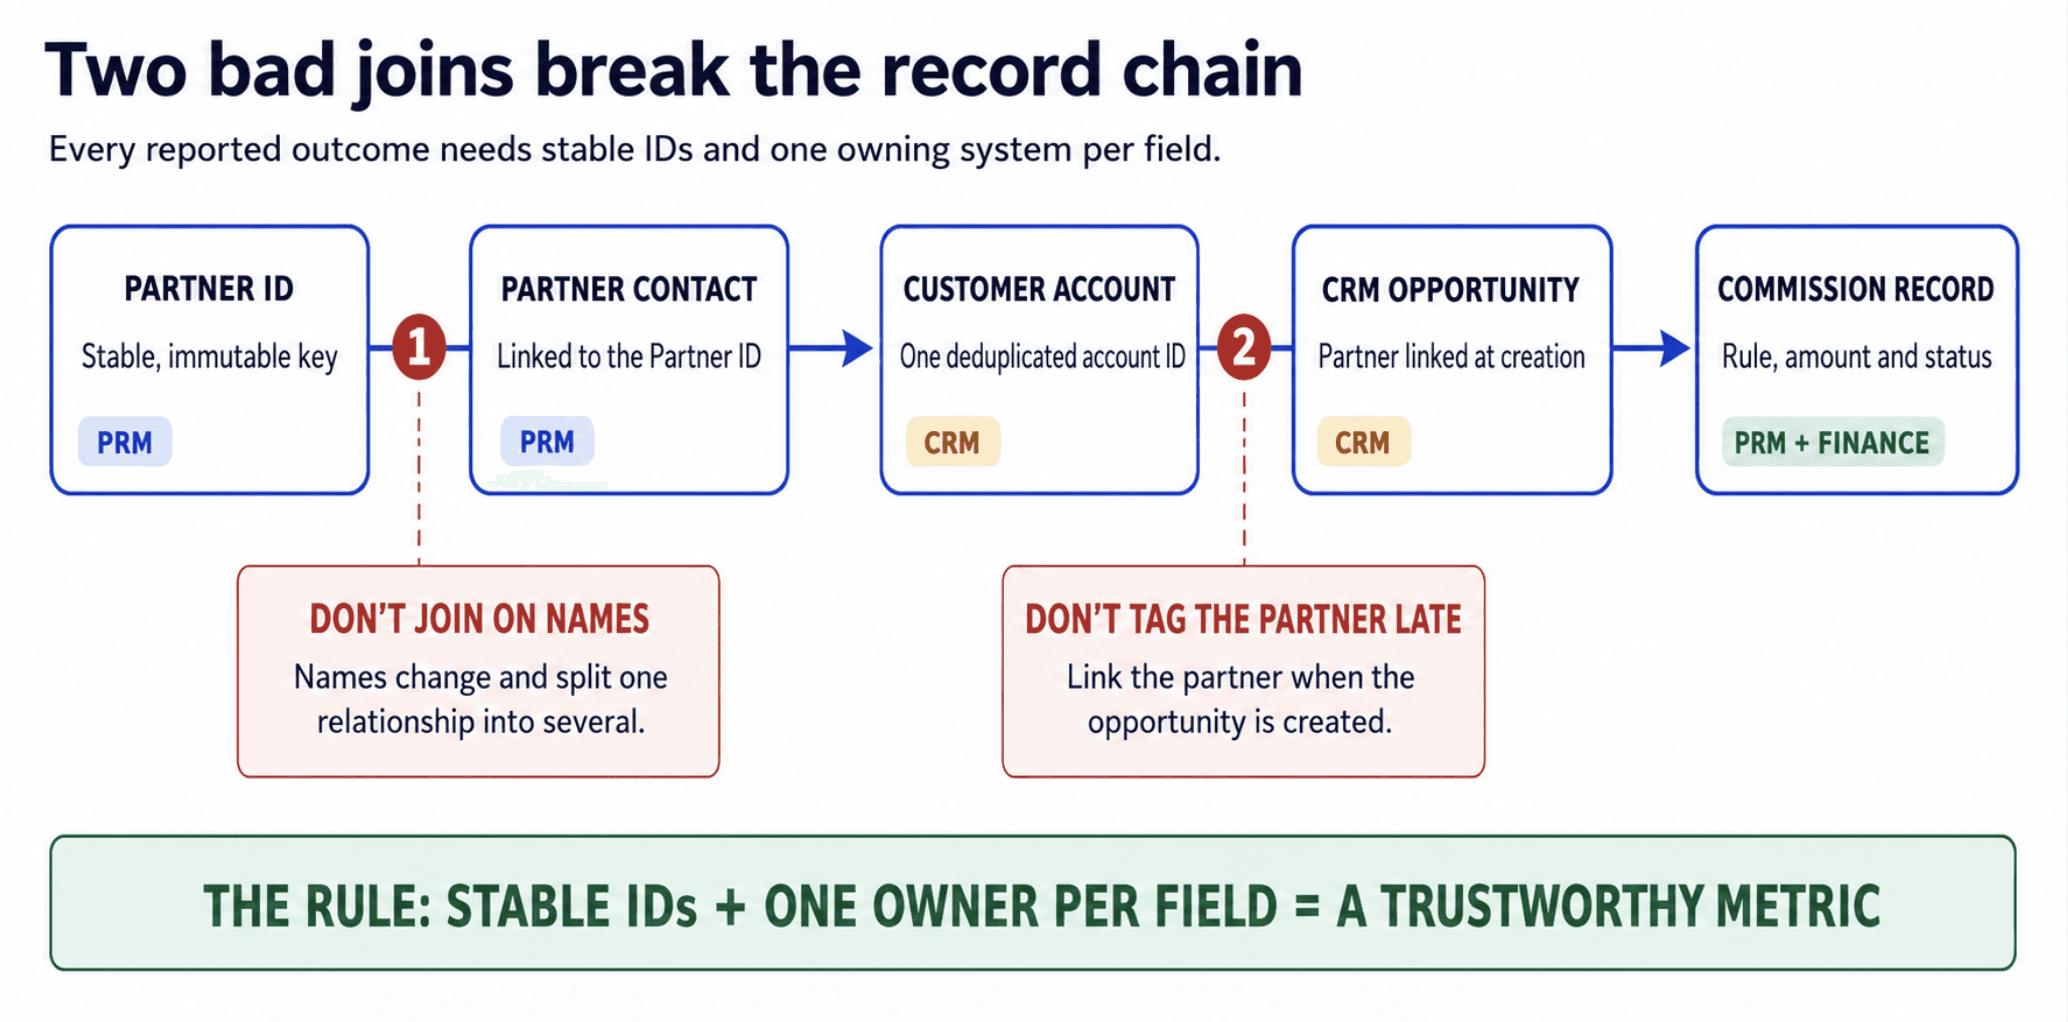
Figure 3: Where partner reporting actually breaks. Every join in the chain is a place to lose a deal or double count one, and every field needs a single owning system.
Use stable IDs, and decide which system owns each field. The PRM owns the partner relationship, tier, agreement and partner-facing workflow. The CRM owns opportunity stage, amount, owning seller and close outcome. Both must share the same record identifiers, or you are reconciling by hand forever.
This is the least glamorous work in partnerships and the highest leverage. It is also the part that quietly eats a headcount when it lives in tabs, which is the argument made at length in the hidden cost of managing partners in spreadsheets.
If your stack is Salesforce, HubSpot or Pipedrive, the join should be a configuration decision rather than a project. Partner.io's CRM integrations and webhooks exist for this, with dedicated setups for Salesforce, HubSpot and Pipedrive.
I: Identify the motion
Store the motion on the opportunity or its associated partner record: referral, co-sell, reseller, agency or solution delivery, technology integration, affiliate or marketing.
Then store the partner's role separately.
A single deal can involve an originator, an influencer, a reseller and an implementation partner. Motion tells you which operating model created the record. Role tells you what each participant did. Collapse the two and you can never answer "should we keep funding this motion" without a manual audit.
V: Verify the event
A partner name added to an opportunity the day before close is not evidence. It is a commission claim.
Valid evidence looks like a dated referral submitted before an active opportunity existed, an accepted deal registration, a warm introduction to a named buyer, a technical validation meeting with a recorded outcome, a partner-created business case that moved the opportunity forward, a reseller purchase order or marketplace transaction, or a completed implementation tied to the customer account.
Set an attribution window. Name the single person who can approve exceptions. Log every exception.
Without those controls, "influence" expands until it means a partner existed somewhere near the account.
One practical detail that most programs get wrong: capture buyer consent at submission, not at close. If a partner is passing you named contact data, the lawful basis has to exist at the moment of the handover, and the ICO is explicit that you must determine and document your lawful basis before you start using the personal information, and that you cannot usually swap from consent to another basis later. Put the consent field on the referral submission form and make it required.
E: Evaluate the economics
Revenue is not return.
For a referral program, include commission, software, labour and campaign spend. For a reseller program, include discount, enablement and support cost. For an integration program, include engineering, maintenance and joint marketing.
Then compare the outcome with a sensible baseline. Did partner-sourced deals convert better? Did co-sell shorten the cycle? Did agency-served customers retain? Did the reseller produce enough gross profit to justify the margin you gave away?
If you want the blunt version of that comparison against paid acquisition, we ran it in 1 pound on ads vs 1 pound on partners.
A metric that fails any LIVE gate is not ready for leadership. It is ready for a fix.
Write the attribution contract before you calculate revenue
Most arguments about partner-sourced revenue are definition failures dressed up as politics.
Write a one-page attribution contract. Get Sales, Partnerships, RevOps and Finance to approve it before the dashboard is built. Version it. Date it.
Credit type | Definition | Evidence required |
|---|---|---|
Partner-sourced | The partner originated the account or opportunity before an active qualified sales process existed | Dated referral or accepted registration, with no pre-existing qualified opportunity |
Partner-influenced | The opportunity already existed and the partner completed an agreed action that helped it progress | Dated action, named outcome, linked opportunity, valid attribution window |
Partner-transacted | The commercial transaction passed through a reseller, marketplace or distributor | Order, invoice, marketplace transaction or reseller record |
Partner-fulfilled | The partner delivered implementation, adoption, support or services | Assigned delivery record, signed scope or completed milestone |
These roles overlap. Their revenue totals must not.
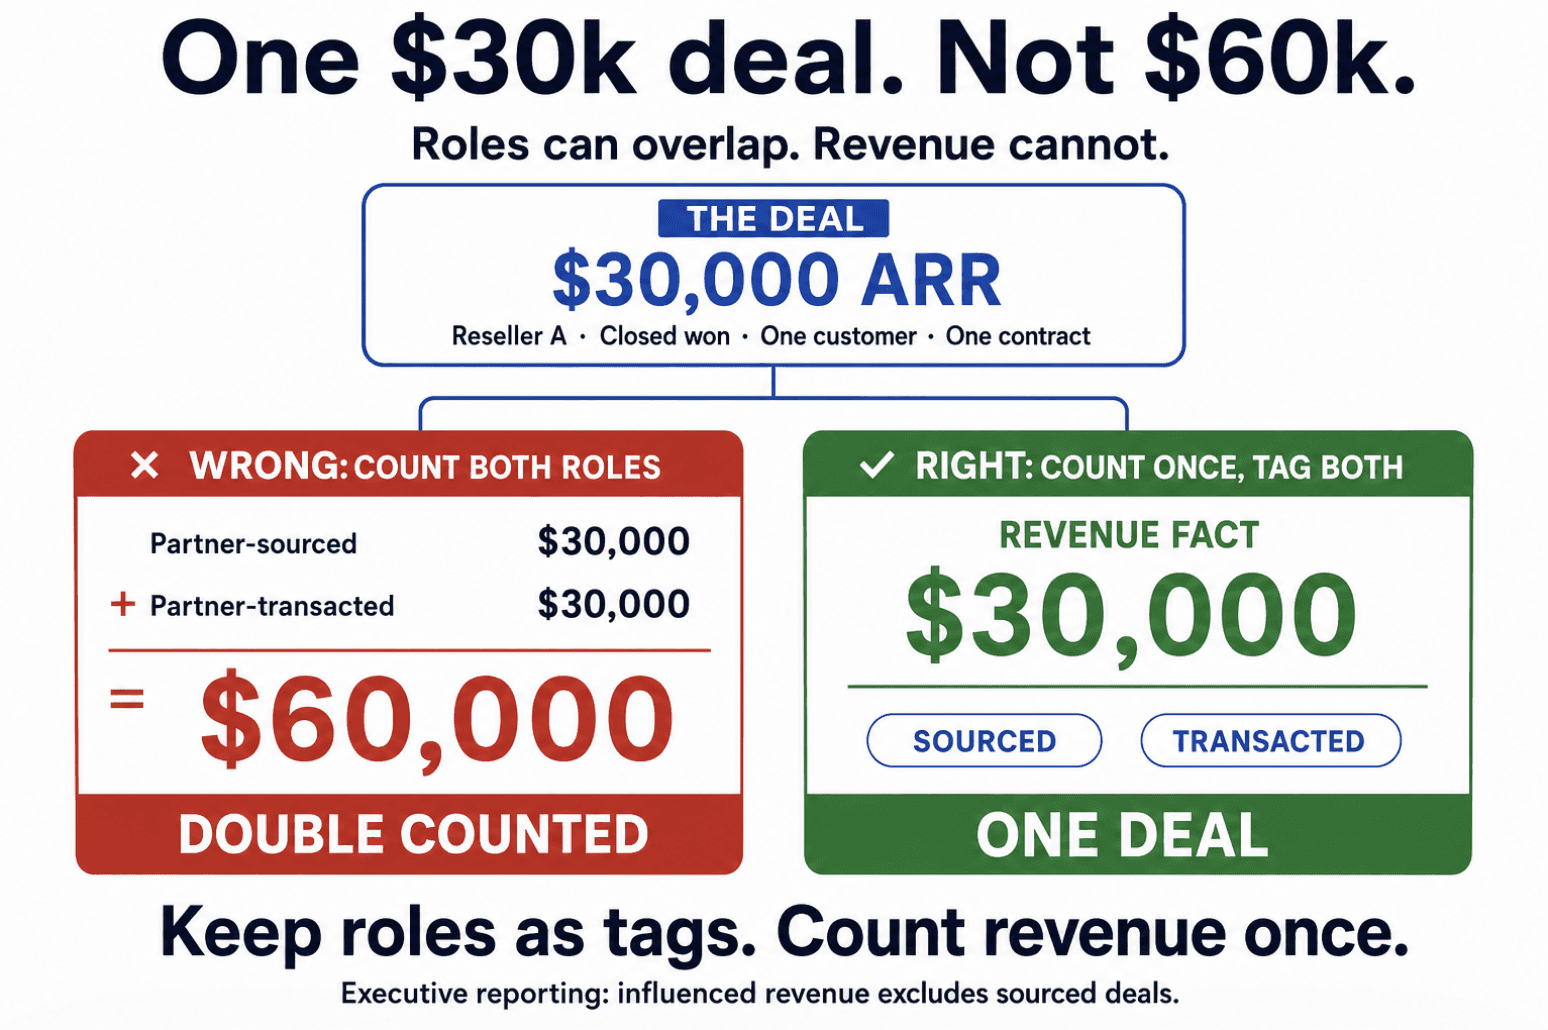
Figure 4: The most common way partner revenue gets inflated, and the fix. One deal, two roles, one number.
If a reseller sourced and transacted a $30,000 ARR deal, report $30,000 as sourced and mark the deal as transacted. Do not announce $60,000 of partner revenue. Someone in finance will find it, and when they do, every number you have ever presented becomes suspect.
For the executive view, report influenced revenue excluding sourced deals. Keep the multi-role detail in the layer beneath.
What else the contract has to define
Your attribution contract is not finished until it answers all of these:
When a referral becomes accepted, and separately, when it becomes qualified
The lookback window and the influence window, in days
Treatment of sales-owned accounts and accounts already in an active cycle
How duplicate partner claims are resolved, and by whom
Multi-partner commission splitting rules
Renewal and expansion credit, including when it stops
Policy version and effective date
Exception ownership and an audit history
CRM attribution tooling will happily distribute credit across dozens of interactions. HubSpot's attribution report documentation separates contact create, deal create and revenue attribution, and states plainly that "each interaction by the same contact is counted separately in the attribution report", so a partner who sends four emails registers four interactions rather than one relationship.
Two details in that documentation are worth knowing before you promise anyone a number. Deal create and revenue attribution are Marketing Hub Enterprise features, not something every seat has. And HubSpot samples: its attribution model processes up to 100,000 associations or activities per deal and drops lower-impact interactions beyond that, which means the tool is already making silent decisions about which evidence counts.
The model is a maths problem. The credit is a policy decision. Never confuse the two.
That decision belongs in the contract, signed, dated and visible to partners in the partner portal so they can see how they will be judged before they invest a quarter in you.
The ten-metric partner scorecard that survives a revenue meeting
Most programs need ten core measures. Not thirty.
Metric | Calculation | What it exposes |
|---|---|---|
Partner activation rate | Partners completing the motion-specific first value event / eligible partners in the cohort | Onboarding friction |
Median time to first value | Median days from accepted invitation to first value event | Speed to useful action |
Productive-partner rate | Partners producing an accepted opportunity or customer outcome / eligible partners | Real depth of the active base |
Accepted-opportunity rate | Accepted partner opportunities / submitted opportunities | Submission quality |
Partner-sourced qualified pipeline | Open qualified opportunity value with verified partner source | Near-term commercial potential |
Partner-sourced new ARR | Closed-won new ARR with verified partner source | Recurring revenue originated |
Exclusive partner-influenced ARR | Closed-won new ARR with verified influence, excluding sourced deals | Documented assistance, no double counting |
Win rate | Won / (won + lost) within a defined qualified cohort | Conversion quality |
Median sales cycle | Median days from qualification to closed outcome | Deal velocity |
Partner program ROI | (Attributable gross profit less total program cost) / total program cost | Economic return |
Add two quarterly guardrails. First, customer retention by source cohort: partner-sourced customers who churn faster than direct are a warning about fit, not a win. Second, revenue concentration: the share of partner revenue produced by your top one, three and five partners.
Three modelling choices worth defending
Use the median sales cycle, not the mean. One 400-day zombie deal wrecks an average. Show the 75th percentile and a stale-opportunity count when volume allows it.
Use qualified pipeline, not submitted pipeline. A partner can type any value into a form. Pipeline becomes credible only after sales validates account, need and amount against the same standard applied to direct opportunities.
Do not put 100% of gross profit into ROI because a partner attended one call. Keep sourced economics separate, and treat influenced performance as association until a matched analysis or a holdout supports an incrementality claim. If you want the underlying discipline, David Skok's SaaS Metrics 2.0 is still the clearest explanation of why cohorts and unit economics beat aggregate totals, and it applies to partner cohorts exactly as it does to customer ones.
One more, for anyone running internationally: report in a single agreed currency using a defined rate and rate date, and preserve the original amount and currency on the deal. Put ISO 4217 codes on every record, no exceptions. Mixing dollars, pounds and euros is a remarkably easy way to manufacture growth you did not earn.
Activation should mean first value, not first login
Teams define activation around whatever their software makes easiest to count. That is how you end up reporting engagement.
A login proves access. A training completion proves content consumption. Neither proves commercial intent.
Define activation by motion and measure it by cohort. If 20 referral partners joined in January and eight produced an accepted opportunity within 60 days, your 60-day activation rate is 40%. Do not blend them with partners recruited yesterday or dormant partners signed three years ago. Cohorts or nothing.
Keep course completion and portal activity as diagnostics rather than headline metrics. High training completion with low activation means the training is polished and commercially pointless. Low completion where activated partners still produce means the course is too long and the deal is doing the teaching.
The engagement hub is where that diagnostic layer should live. The executive dashboard is not.
What this looks like in the real world
Consider a composite example. The numbers are illustrative, the pattern is not.
A B2B SaaS company signs 18 agencies. Eleven finish onboarding, so the team reports 61% engagement. The slide gets a green tick.
Then look at what happened next. Four submitted a referral. Two of those were duplicate accounts already in the CRM. One sat outside the ICP. One was accepted.
The slide says 61%. Commercial activation is 6%. That is not a reporting nuance. It is a different business.
And the answer is not another webinar. Do this instead:
Pause broad recruitment. You do not have a volume problem.
Add ICP and buyer-consent fields to the referral form so unqualified submissions are filtered before they reach a seller.
Give sales a one-business-day acceptance SLA. Nothing kills partner momentum faster than silence.
Show rejection reasons back to partners. A rejected referral with a reason is training. A rejected referral with no reason is churn.
Review the cohort on accepted referrals and response time, not portal traffic.
Then move portal traffic to the appendix, where it belongs.
If recruitment quality is the actual bottleneck, that is a sourcing problem rather than a reporting one. Partner discovery is the front end of this, and we covered the mechanics in find and recruit better partners faster.
See the eight numbers on your own data
You do not need a data warehouse to run this framework. You need referrals, deal registrations, CRM opportunities, commissions and payouts on one record.
Start your free 7-day trial of Partner.io and see your first cohort. No credit card, no contract, cancel any time. Or book a demo and bring your current dashboard so we can pull it apart together.
Compare partners against your own baseline, not somebody else's
External benchmarks make planning feel scientific while hiding the differences that matter: segment, motion, deal size, sales stage, geography.
Use internal comparisons first:
Partner-sourced vs direct deals in the same segment
Co-sell-influenced vs non-influenced deals from the same starting stage
Agency-served vs self-implemented customers of similar size
Integration-activated vs non-integrated customers of similar maturity
One partner cohort vs the previous cohort after the same number of days
Match on region, product, segment, deal-size band and starting stage wherever you can. A strategic partner introduced only on late-stage enterprise deals will post a miraculous win rate if you compare it with every raw inbound lead. That is not a partner effect, it is a selection effect with a commission plan attached.
Be honest about the direction of causation too. Partner involvement is correlation until the operating evidence says otherwise. Partners may accelerate strong deals. Strong deals also attract partner attention.
For small samples, always show the count beside the rate. Three wins from four opportunities is 75%, and it is not a planning model.
Where overlap data does the heavy lifting is co-sell selection rather than co-sell scoring. Account mapping tells you which accounts a partner can genuinely open. It does not tell you the partner caused the win.
Backsolve targets from revenue and capacity
A target should expose the work required to hit it. If it does not, it is a wish with a deadline.
Suppose the quarterly goal is $300,000 in partner-sourced new ARR, average new ARR per accepted opportunity is $25,000, and the current win rate is 30%.
The program needs roughly 40 accepted opportunities:
$300,000 / $25,000 = 12 wins needed
12 wins / 30% win rate = 40 accepted opportunities
Now check capacity. If ten productive partners can each create one accepted opportunity per quarter, your plan supports ten.

Figure 5: The target is not the problem. The 30-opportunity capacity gap is.
That is not a motivation problem. It is a 30-opportunity capacity gap, and there are exactly five honest responses:
Recruit more ICP-fit partners and accept the lag before they activate
Increase opportunities per productive partner through enablement or coverage
Improve acceptance, conversion or deal value
Add another partner motion with a different shape
Reduce the target
Good metrics force that conversation in week two, not week eleven. If your plan depends on option one, read how to build a partnership program that does not collapse into spreadsheet chaos before you sign twenty more partners you cannot service.
Match the reporting cadence to the decision
Quarterly reviews are too slow to fix a broken handoff. Daily ROI dashboards are theatre. Each cadence has one job.
Weekly: fix the flow
Review new submissions, acceptance decisions, SLA misses, stale opportunities, promised partner actions, CRM sync failures and rejection reasons. End every weekly with owners and dates. No owner, no meeting.
Monthly: manage the motion
Review activation by cohort, productive partners, acceptance rate, qualified pipeline, stage conversion, median velocity, forecast changes and partner concentration. Decide where to improve enablement, where to slow recruitment and where to change coverage.
Quarterly: allocate investment
Review sourced and exclusive influenced ARR, gross profit, ROI, retention, expansion, cost by motion and concentration risk. Decide which motions earn more budget and which lose it. A motion that has never cleared the E gate in LIVE should be defended or ended.
What to do when the numbers break
The dashboard earns its keep on the days the result is uncomfortable.
Symptom | Probable cause | First action |
|---|---|---|
Many signed partners, few productive | Loose recruitment, or no clear first action | Pause volume recruitment, inspect the last two cohorts |
Submissions rise, acceptance falls | ICP rules unclear to partners | Add qualification fields and structured rejection reasons |
Accepted referrals stall | Slow routing, weak context, or seller resistance | Set an owner and an SLA, put partner context on the CRM record |
Pipeline rises, revenue does not | Inflated values, weak qualification, stale stages | Age the pipeline, requalify the largest deals |
Influenced revenue jumps overnight | Retroactive tagging or a loosened definition | Audit event dates, policy version and edited records |
Co-sell meetings rise, velocity does not | Activity mistaken for assistance | Require a requested action, an outcome and a next step |
Integration installs rise, usage stays flat | Installation mistaken for activation | Instrument the first successful customer outcome |
Revenue looks strong, ROI is weak | Hidden discount, commission or support cost | Report contribution margin by motion and by partner |
One partner dominates | Concentration risk | Protect the relationship while building a second source of capacity |
PRM and CRM disagree | Broken IDs or unclear field ownership | Assign a source of truth per field, reconcile ten live deals |
Do not answer bad data with a prettier chart.
Pull ten records. Follow each one from partner action to CRM opportunity to close outcome to payout. Most attribution faults become obvious at record level within an hour, and none of them become obvious in a bar chart.
The executive dashboard needs eight numbers
Keep the top layer tight enough to read in a forecast meeting without scrolling.
Partner-sourced qualified pipeline
Partner-sourced new ARR
Exclusive partner-influenced new ARR
Productive partners against the eligible cohort
Accepted-opportunity rate
Win rate versus the direct baseline
Median sales cycle versus the direct baseline
Partner program ROI
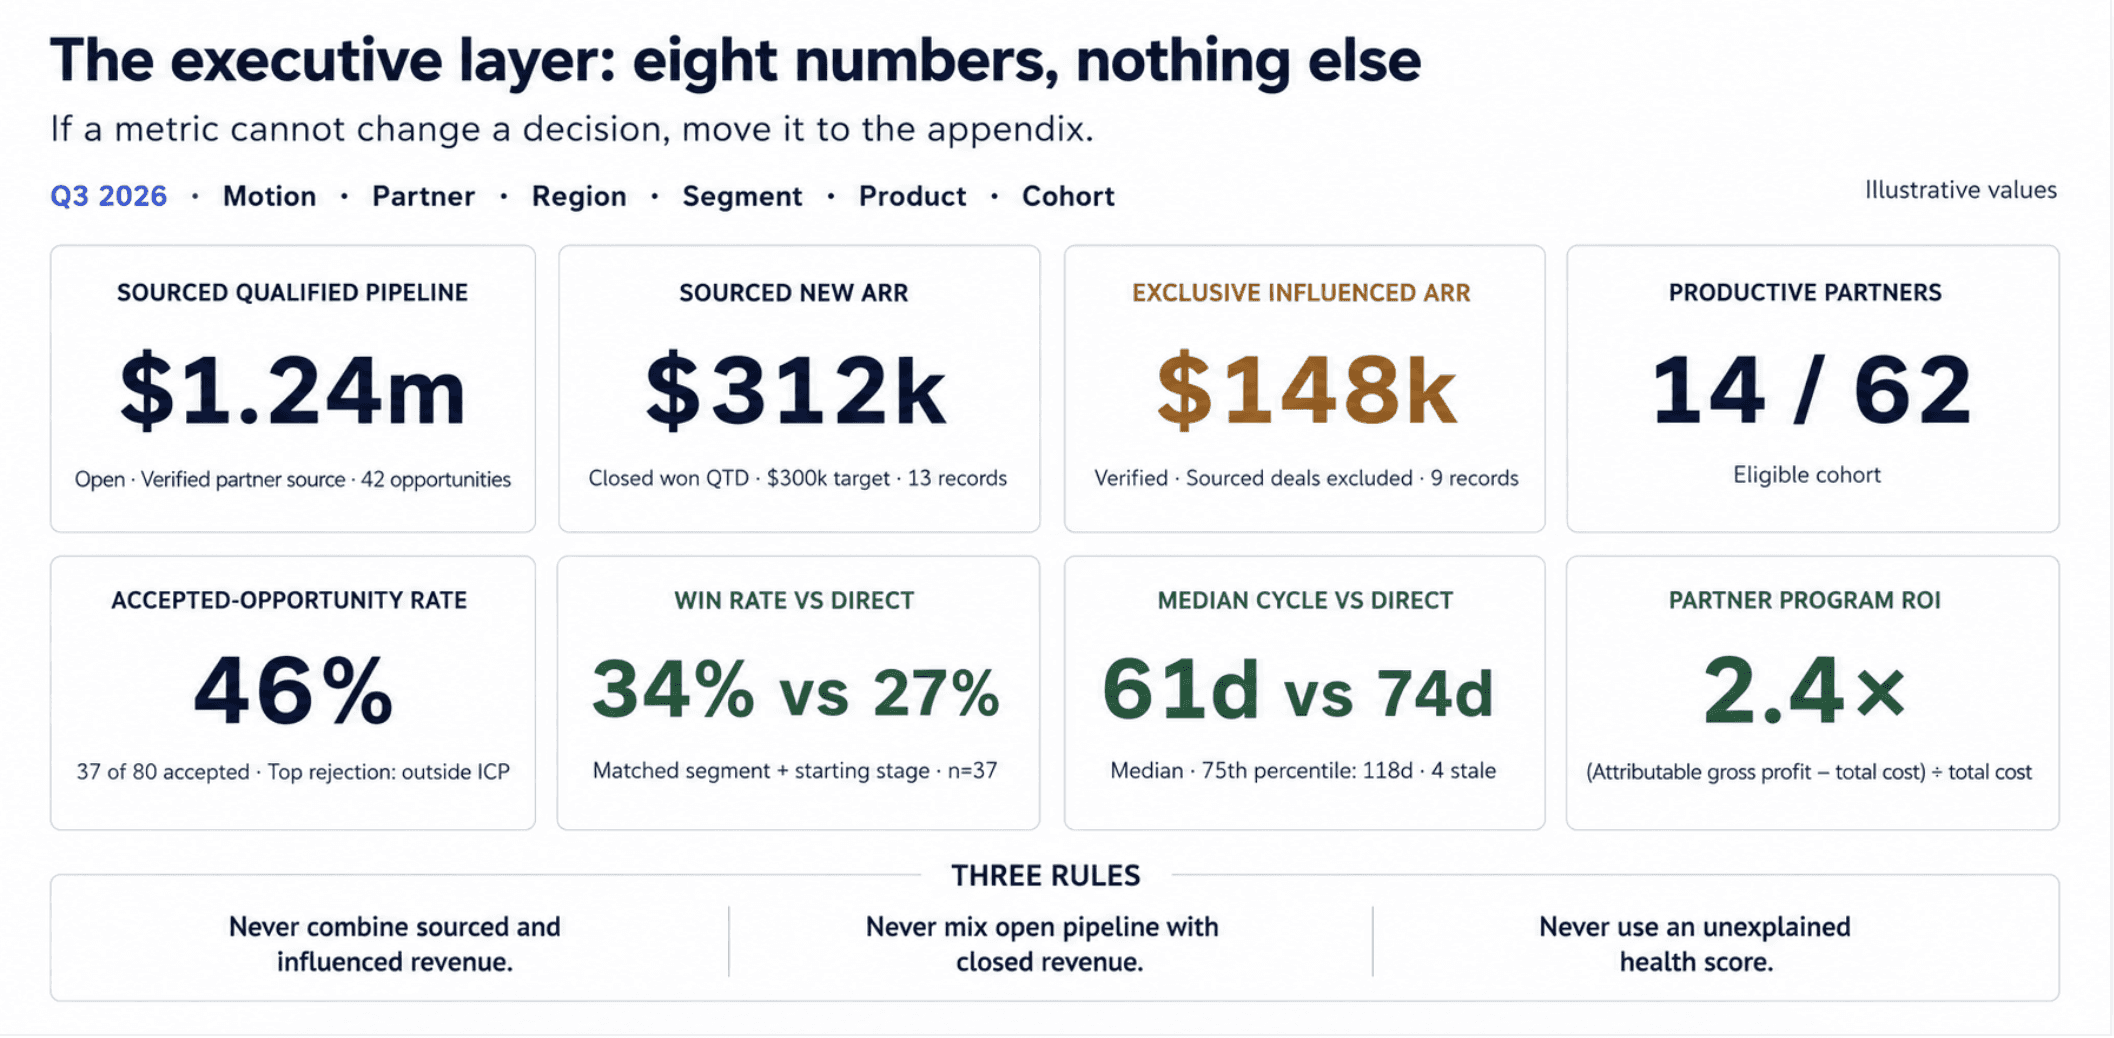
Figure 6: The whole executive layer. Eight tiles, every one filterable by motion, partner, region, segment, product, cohort and period, and every one drillable to the underlying records. Values shown are illustrative.
Three rules for the top layer. Do not combine sourced and influenced revenue in one figure. Do not mix open pipeline with closed revenue on the same tile. Do not ship a partner health score whose weighting nobody can explain.
If you do build a health score, use observable events and validate the weights against outcomes. A certification earns weight only if it predicts commercial action. A login earns nothing until the evidence shows it precedes useful behaviour.
Measurement fails when the workflow lives in five tools
A spreadsheet can help you design a partner program. It struggles to operate one.
The problems arrive at the joins. Referrals in a form, opportunities in the CRM, conversations in Slack, training records in an LMS, commission rules in a doc, payment approvals in an inbox. Different names, different timestamps, no shared ID.
So somebody rebuilds the truth every Friday afternoon. Partners email for updates. Sales changes stages without telling anyone. Finance calculates commission from a different number than the one on the slide.
Once the attribution contract is agreed, the question stops being "what should we measure" and becomes "where does this run".
That is the job Partner.io does as the execution layer underneath the policy:
Referrals and leads captured through the channels partners already use, including Slack, each arriving with partner details, source, metadata and CRM status, so the V gate is satisfied at submission rather than reconstructed at close
Account mapping that turns overlaps into a prioritised co-sell list instead of a shared spreadsheet
A partner portal where partners see pipeline progress themselves rather than chasing your team for it
Commissions and payouts with recurring, one-off and multi-layered rules, SPIFFs, MDF, auto-generated invoices, real-time partner statements and approval thresholds, paid out through Stripe
CRM integrations and webhooks so the partner record and the opportunity record share an identifier instead of a name
That is where PRM reporting earns its place. It turns a written policy into a repeatable workflow, and it keeps the commercial outcome attached to the activity that created it.
Software will not rescue dishonest attribution. It will stop a sound policy decaying into spreadsheets, missing context and manual exceptions. See how other B2B SaaS teams have run it in the case studies, and check the pricing before you build anything internally.
Build the metric contract before your next revenue meeting
Do not try to fix everything. Start with one motion and one week of work.
Pick one motion. Referral is usually the fastest to prove.
Define sourced, influenced, transacted and fulfilled credit in writing, and get four signatures.
Choose one first value event for that motion.
Link the partner, account, opportunity and outcome records with stable IDs.
Set field ownership, evidence requirements and attribution windows.
Publish the eight-number dashboard.
Audit ten live opportunities before you trust a single total.
Then put the workflow somewhere it can survive a busy quarter, so referrals, deal progress, attribution, commission and payment follow the same record from first action to revenue.
Partner revenue should never depend on who argues best in the forecast meeting.
Build a system that makes the answer visible before the argument starts.
Try Partner.io free for 7 days
Referral capture, deal registration, account mapping, CRM sync, commission rules and partner payouts on one record, with the reporting layer already attached.
Start your free 7-day trial. No credit card, no contract, cancel any time. Prefer a walkthrough on your own numbers first? Book a demo.
Related reading