Product
Customer Journey Map Template That Actually Works

Customer Journey Map Template That Actually Works
Most customer journey maps are theatre.
Big diagrams. Colourful stages. A workshop everyone nods through.
Three months later, conversion is flat. Onboarding still drags. Retention slips quietly.
If your journey map does not change behaviour, it is decoration.
Let’s fix that.
The Real Reason Journey Maps Fail
The failure is predictable.
Stages are vague.
Emotions are listed but not tied to numbers.
Ownership is shared, which means it is owned by no one.
Pain points are described but not solved.
The result is a document that explains the problem and protects everyone from fixing it.
Customer journey mapping only works when it forces decisions.
Who owns this stage?
What blocks progress?
What metric proves it is working?
If those answers are soft, the map is useless.
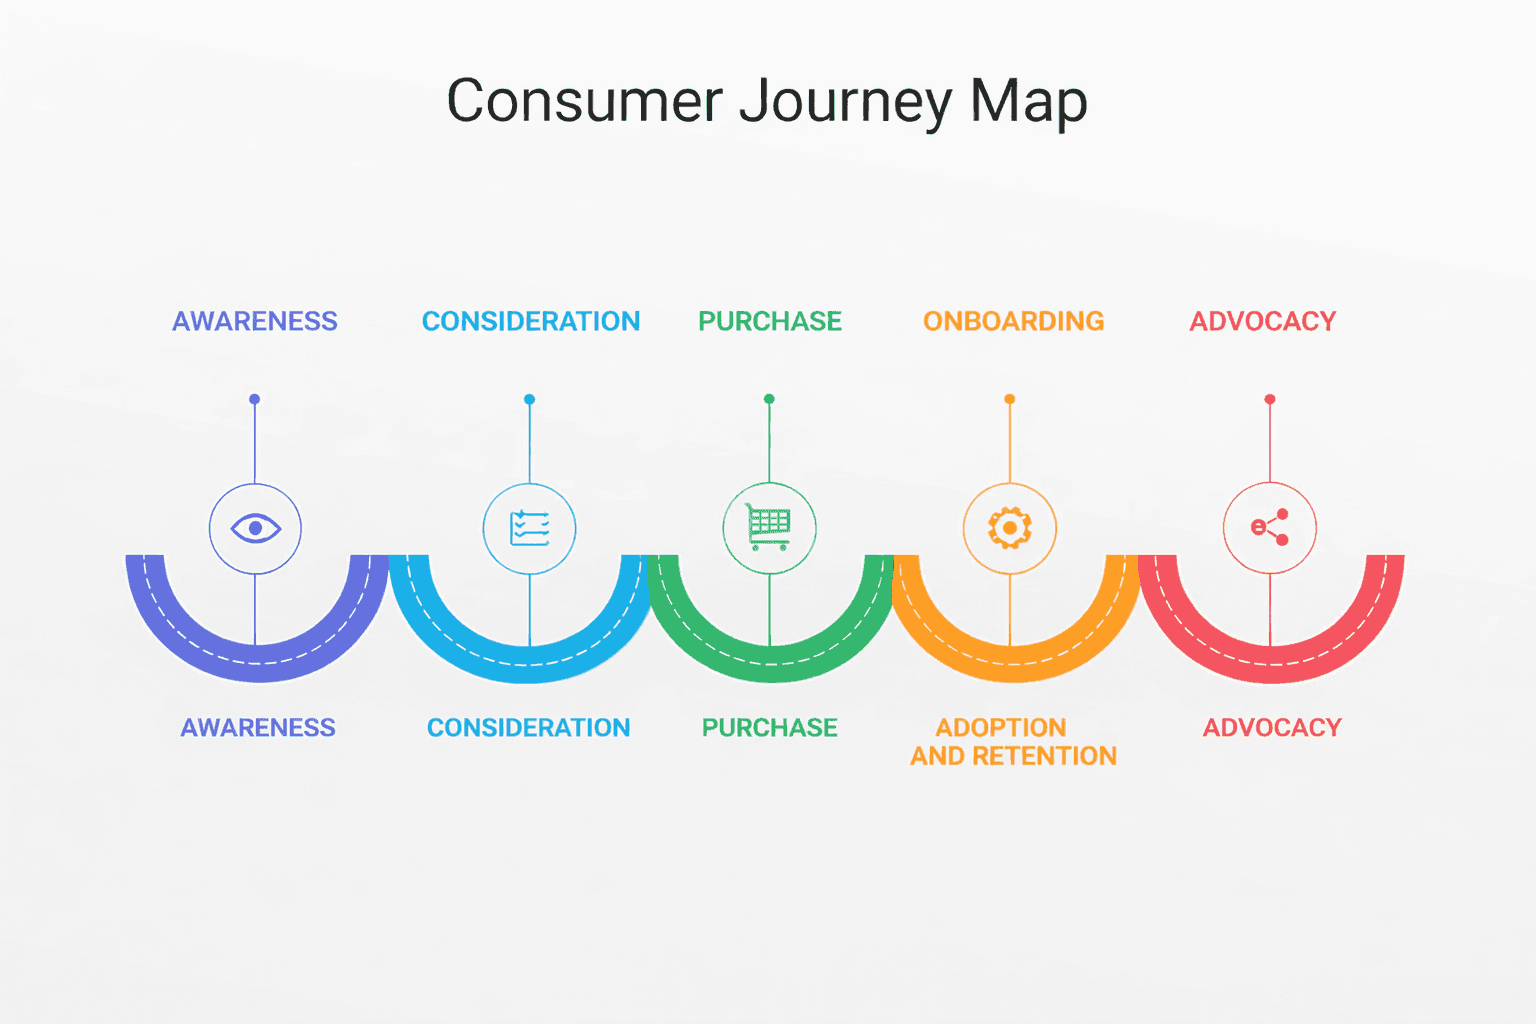
The Only Six Stages You Need
Keep it tight. Six stages across the awareness to advocacy funnel:
Awareness
Consideration
Purchase
Onboarding
Adoption and Retention
Advocacy
Anything more is noise. Anything less hides friction.
Now make each stage earn its place.

Awareness
Goal: Decide whether this problem matters.
Touchpoints:
Search
Social
Referrals
Paid campaigns
Friction:
Generic messaging
Inflated claims
No clear cost of doing nothing
Metrics:
Qualified traffic
Demo requests
Engagement depth
If your messaging cannot articulate the risk of inaction, attention dies here.
Consideration
Goal: Reduce risk and compare options.
Touchpoints:
Website deep dives
Case studies
Demos
Peer validation
Friction:
Tools look identical
Switching feels painful
ROI is unclear
Metrics:
Demo to opportunity rate
Sales cycle length
Conversion to proposal
Most pipeline stalls here. Not because the product is weak, but because the risk feels high.
Your journey map must identify the single objection that kills momentum. Not five. One.
Purchase
Goal: Commit without regret.
Touchpoints:
Proposal
Pricing discussion
Contract review
Security checks
Friction:
Budget pressure
Internal alignment
Procurement delay
Metrics:
Close rate
Deal size
Time to signature
At this stage, clarity wins. Confusion kills.
If your pricing or process requires explanation on every call, your map should flag it.

Onboarding
Goal: See value fast.
Touchpoints:
Kickoff
Setup steps
Integrations
Training
Friction:
Poor documentation
Slow configuration
No clear next step
Metrics:
Time to first value
Activation rate
Early churn
Most retention problems start here.
If value is not visible within weeks, doubt grows quietly.
Adoption and Retention
Goal: Prove the decision was right.
Touchpoints:
In-product experience
Support
Reporting
Reviews
Friction:
Low usage
Feature confusion
Slow response times
Weak attribution
Metrics:
Net revenue retention
Usage depth
Expansion revenue
If usage does not tie to business outcomes, renewal becomes a debate.
Retention is not a mood. It is a measurable outcome.
Advocacy
Goal: Turn success into status.
Touchpoints:
Reviews
Case studies
Referrals
Events
Friction:
No incentive
No clear process
No recognition
Metrics:
Referral revenue
NPS
Public endorsements
Advocacy is not luck. It is designed.
If customers win and nobody asks them to share it, you wasted momentum.
The Framework That Makes This Operational
Use this five-part model for every stage:
G.O.A.L.S.
G: Goal. What outcome the customer wants.
O: Obstacle. What slows or blocks them.
A: Action. What you ask them to do next.
L: Lead owner. One accountable person.
S: Success metric. A number, not a feeling.
No stage survives this framework without exposing gaps.
If there is no clear owner, the stage leaks.
If there is no metric, the stage is guesswork.
If there is no defined obstacle, the team is blind.
A Quick Reality Check
A SaaS company mapped its onboarding stage.
On paper, it looked solid. Kickoff call. Documentation. Training.
Applying G.O.A.L.S. revealed the flaw. Time to first value had no owner. Sales handed off. Customer success assumed setup would happen. Product assumed the docs were clear.
Activation lagged. Early churn followed.
They rebuilt onboarding with:
A structured kickoff template
A 14-day activation checklist
One accountable owner
A single activation metric
Activation improved. Retention rose. Referrals increased because customers felt confident.
The map did not fix the business. Accountability did.
Stop Building Posters
If your customer journey map lives in a slide deck, it will die in a slide deck.
Journey mapping must be structured, repeatable, and editable.
Each stage needs:
Defined fields
Named owners
Embedded metrics
Action tracking
Deadlines
Without that, you are running workshops, not operations.
Build the Map You Will Actually Use
A proper customer journey map template is infrastructure.
It creates consistency across awareness, consideration, purchase, onboarding, retention, and advocacy. It exposes weak links. It makes ownership visible. It forces metrics into the open.
That requires structure.
Assemble gives you that structure. Not a blank page. Not a messy doc. A repeatable template system where every stage follows the same logic and every action is tracked.
You stop rebuilding the map every quarter. You refine it.
If you are serious about improving conversion and retention, build a journey map that demands accountability.
Anything less is theatre.
Create it properly. Use it daily. Let it drive decisions.
Build it in Assemble.